(Approximate Read-Time: 25 minutes)
The following report presents the introductory section (section1), the results summary section (section 2), and the U.S. IoT Universe results (section 6) from the Internet of Things (IoT) Patent Landscape Reference Report prepared for the 2019 IoT Fuse Conference in Minneapolis, Minnesota. The content noted in any references to sections 3 through 5, and 7 through 12 can be found in the full reference report available via the link below.
1. How to Use this Reference Report
- This is the reference report for the IoT patent landscape study that was prepared for and presented at the April 2019 IoT Fuse Conference in Minneapolis, Minnesota. This contains the complete landscaping results for seven segmentations of the IoT patent information; one for the overall U.S. IoT segment, and six market-specific segments covering agriculture, energy, manufacturing, medical, retail, and smart city. The structure of this reference report is designed so that a reader can utilize the Table of Contents to immediately jump to the section(s) that are of the most interest.
- Section 2 covers the summary results of the entire report and is the most concise executive summary of all the strategic information related to inventors, assignees, geographic disposition, patent literature citations, and technology profiles.
- Section 3 details the derivations of the seven groups of patent documents to be analyzed, one for the overall U.S. IoT segment, and one for each of the six market-specific segments. Refer to this section for information on the keywords and key phrases used to derive the universe of IoT patent documents (from the overall BigQuery patent database) and sub-divide the IoT universe into market segments.
- Section 4 profiles the information contained in the patent database provided in BigQuery by IFI Claims and used in this analysis. Refer to this section for information on the patent database date and geographic coverage.
- Section 5 provides general descriptions and context significance of the tables and heat maps presented in this report. Refer to this section for information on how the tables were derived and the meaning of the tabular information.
- Sections 6 through 12 present the tables and heat maps of the patent landscaping results for the overall U.S. IoT segment and each of the six market-specific segments (agriculture, energy, manufacturing, medical, retail, and smart city). The tables in each of these sections follow the same order and present information on inventors, assignees, geographic disposition, patent literature citations, and technology profiles.
- Finally, the keyword / key phrase search capability of the browser or PDF document viewer, used to display this document, will always be a valuable tool for finding information of interest. There are hundreds of inventors, assignees, companies, countries, patent document numbers, technology keywords, and CPC class codes that are listed throughout this patent landscape reference. Searching for keywords and key phrases can be very helpful in finding information.
2. Results Summary
2.1 Patent Landscape Definition, Process and Significance:
- A patent landscape study is a research process that filters and analyzes patent and patent application information to produce strategic business information that provides overview insights into competitors, technologies, and markets.
- Today, the patent landscape process is all about data science and leveraging semantic analysis, grouping of similar patents and feature data, and common feature analysis to derive insights. The analysis in this report utilizes Google’s BigQuery data warehouse service and the patent datasets provided in BigQuery by IFI Claims. One of the more unique aspects of this project architecture is that BigQuery and the cloud-based patent datasets enable the integration of the analysis into modern data science platforms. The results of this report have been produced via Python programs executed within Jupyter notebooks that access the BigQuery data warehouse via remote SQL queries.
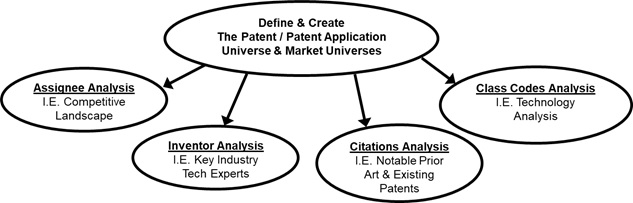
- The diagram below shows the general analysis process used with this report. A universe of patent documents is created using keyword / key phrase matching to derive a broad group of patent documents pertaining to a specific topic (e.g. Internet of Things, or specific IoT market segments). That universe of patent documents is then further grouped by specific feature data (e.g. assignees, inventors, citations, and class codes) to isolate the information to be analyzed. Finally, the feature data is tabulated to organize the trends within the feature data and show insightful results focused on significant strategic business information (competitive landscape, key tech experts, notable prior art and existing patents, and technology profiles).
2.2 U.S. IoT Universe & IoT Market Segments:
- This report focuses on the analysis of U.S. patent applications related to the Internet-of-Things. The universe of IoT patent applications to be analyzed is derived via a key-phrase search using the phrase “internet of things”, in a case insensitive match and with both forms of the phrase, hyphenated and not (“internet of things” and “internet-of-things”). The “internet of things” phrase was matched on patent application text in the title, abstract and description (i.e. all text except the claims). Any patent application that matched the “internet of things” phrase was included in the universe to be analyzed. The IoT universe includes 23,046 patent applications filed between 2004 and 2018 and is referred to through this report as the “U.S. IoT Universe”. More information is available in section 3.1.
- This analysis is limited to patent applications filed in the United States (via the USPTO) in order to focus on quality, as opposed to utilizing a broader set of worldwide patent filings that may be of questionable quality. In particular, IoT patent applications filed in China dramatically distort the international IoT patent landscape. The number of IoT patent applications filed by Chinese entities in China is significantly higher than the total number of IoT patent applications filed in every other country combined. Furthermore, China’s dominant filing presence is not represented in U.S. patent filings by Chinese entities, which can indicate a lack of quality in many Chinese IoT patent filings. In fact, the real situation is that U.S. filed patent applications by Chinese entities is a small fraction of the number of IoT patent filings by U.S. entities. This trend is shown in the column chart of section 3.1.1 and more information is also available in section 2.6.
- The overall IoT patent application universe was further subdivided into six market segments; agriculture, energy, manufacturing, medical, retail and smart city. These market segment divisions were derived via matching keywords and key phrases that best represented the market segments. Landscaping results have been produced for the overall U.S. IoT Universe and the six market segments. More information on the market segment is available in section 3.2.
2.3 Significance of the Tables and Heat Maps:
- The tables, charts, and heat maps listed below are utilized throughout this report for information profiling of the U.S. IoT Universe and the six market segments. The significance of each is summarized below and more detailed information can be found in section 5.
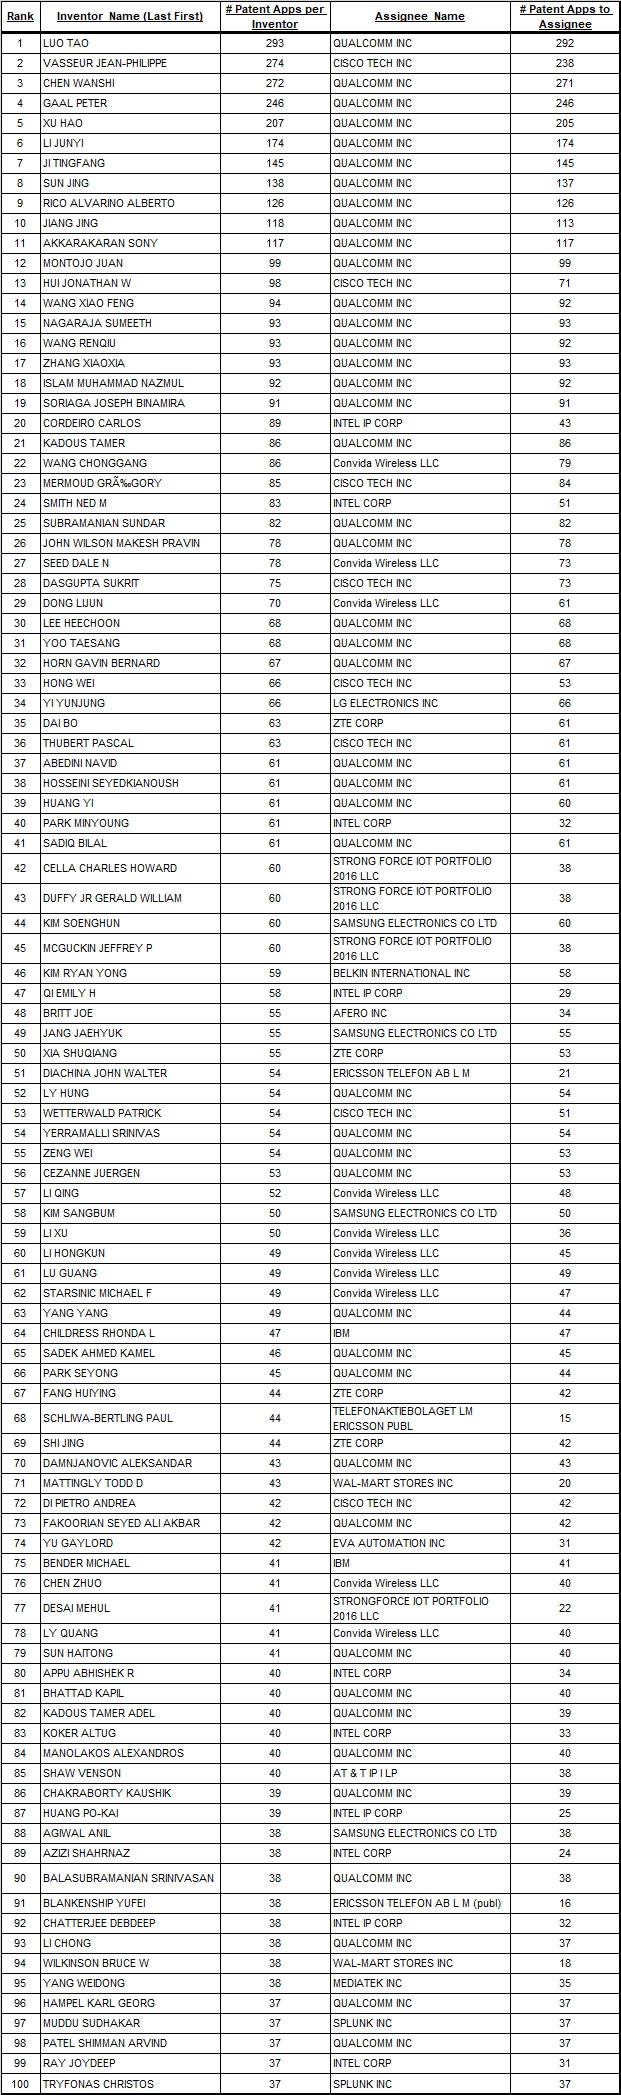
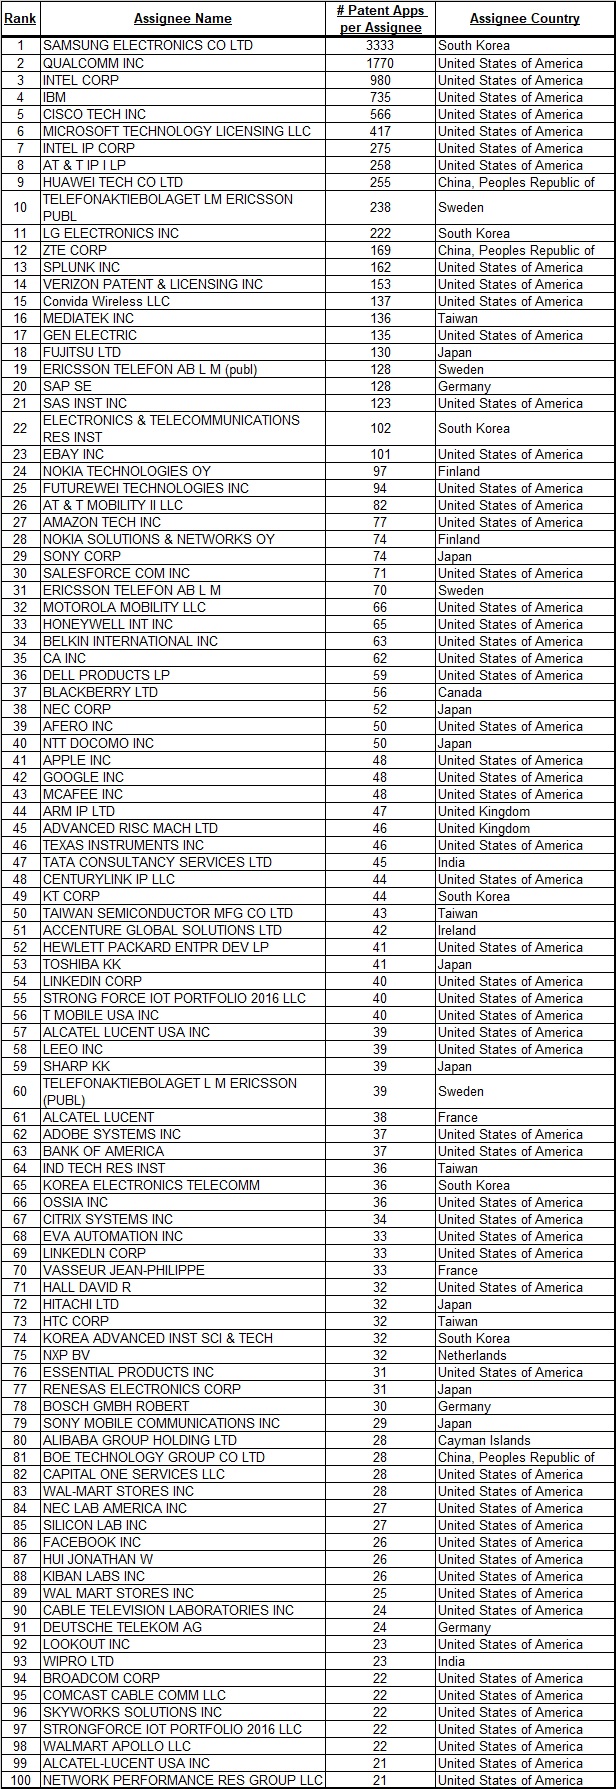
- Top Inventors and Predominant Assignees: This table identifies the top IoT inventors and the entities to which those inventors have assigned the predominant number of patent applications.
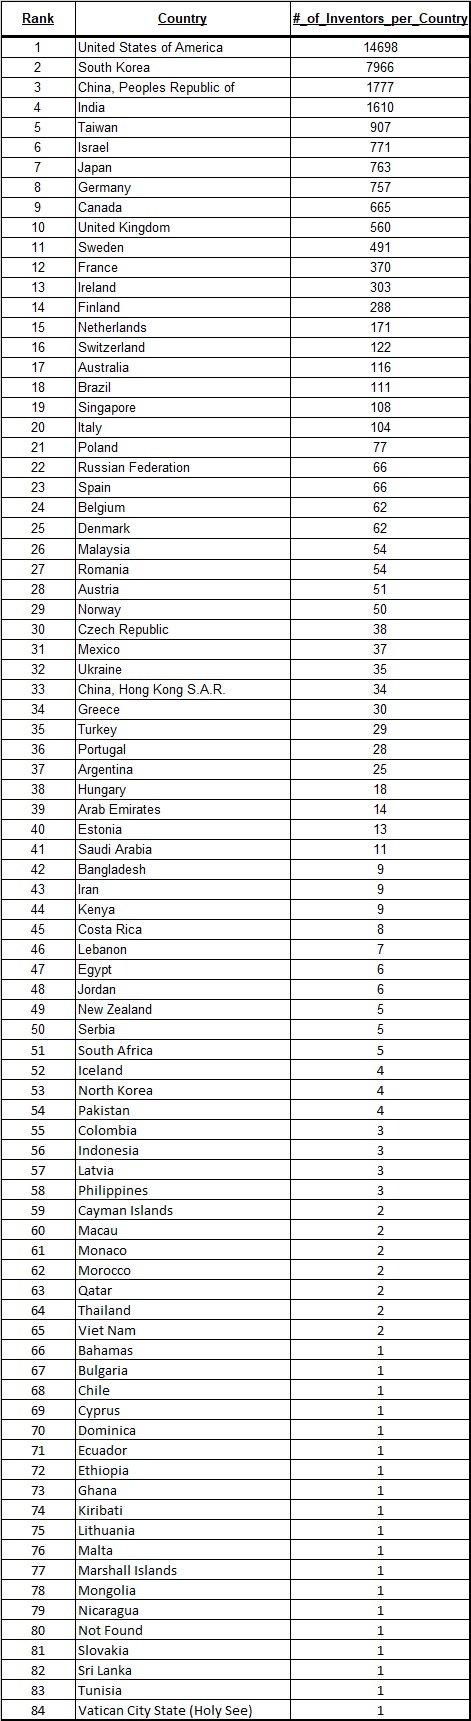
- Number of Inventors by Country: This table shows the ranking of countries based on the overall number of individual IoT inventors per country.
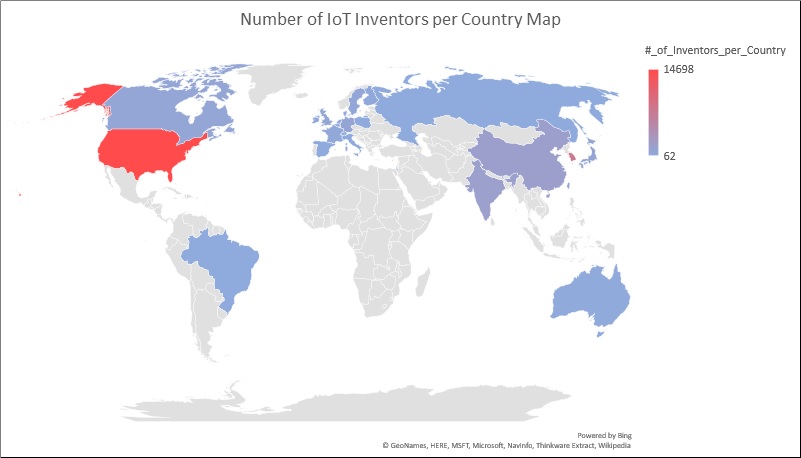
- Heat Map of Number of Inventors by Country: This graphic shows a visual geographic heat map of the number of inventors by country.
- Top Assignees and Assignee Country: This table shows the top IoT patent application assignees and the assignee’s country.
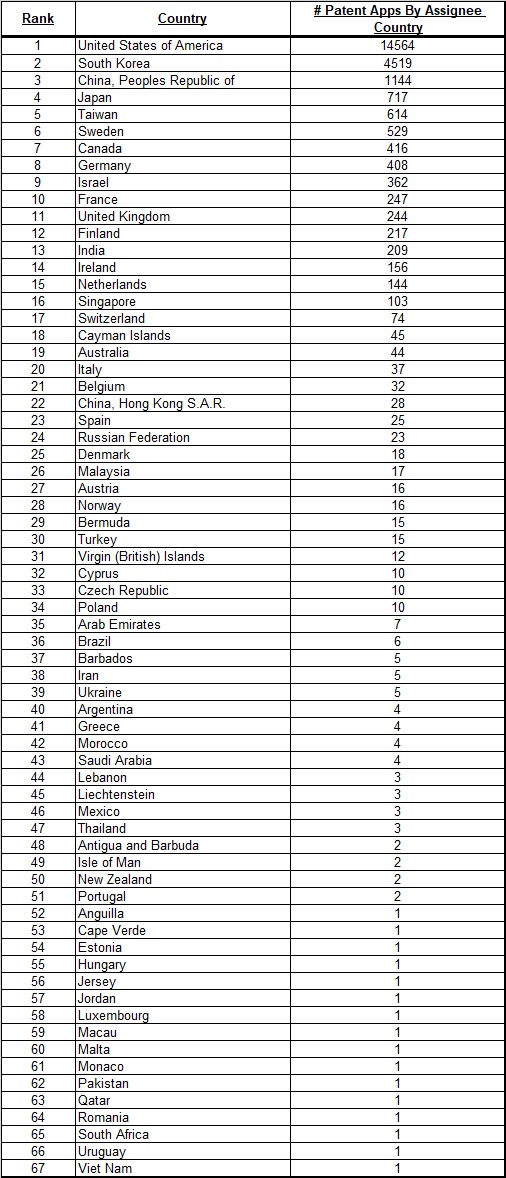
- Number of Patent Application Assignments by Country: This table shows the ranking and geographic distribution of IoT patent application assignments.
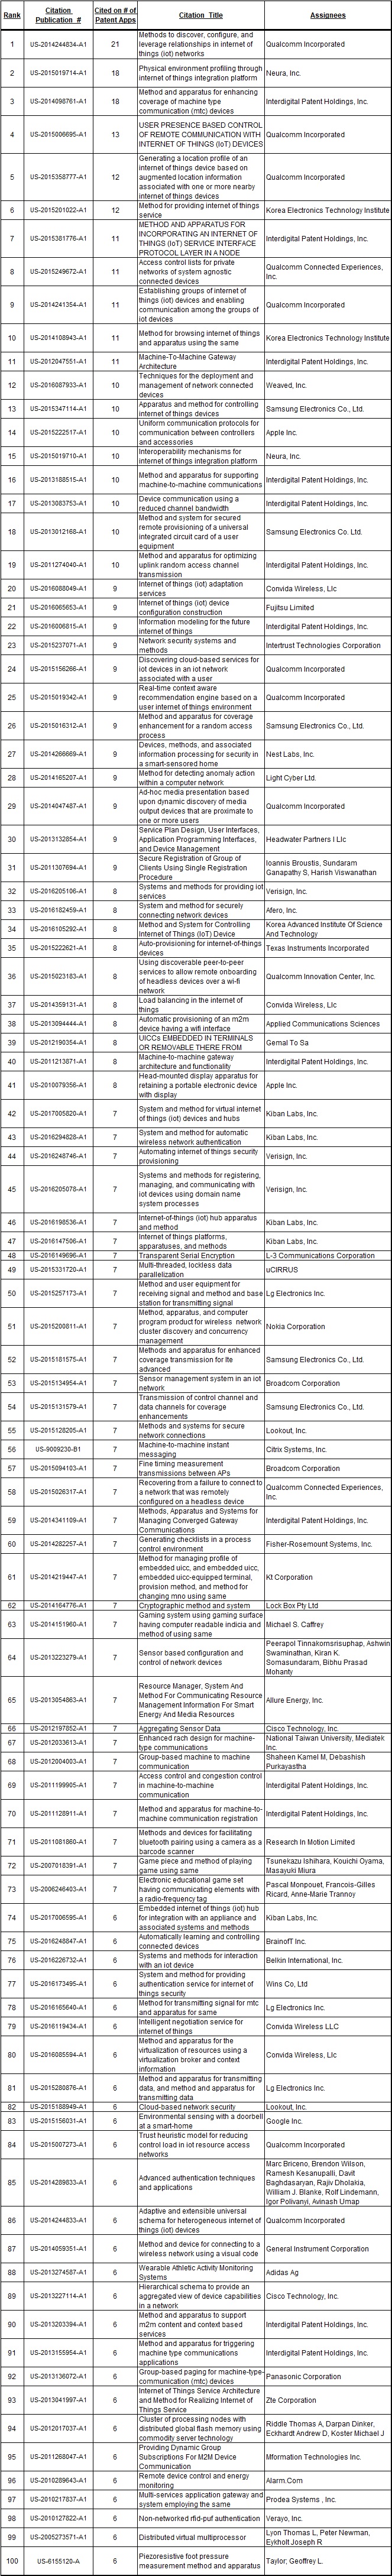
- Top Patent Literature Citations: This table shows the most cited references, across the IoT segment profiled, and generally indicates the significance of the cited patents or applications to the IoT segment.
- Top Patent Literature Citations Sorted by Assignee: This assignee-sorted table shows the assignees that hold significant groups of cited references and thus hold significant intellectual property positions in the IoT segment.
- Technology Profile of Top CPC Group Codes: This table shows the top CPC Group Codes for the IoT segment profiled, and thus provides a ranking of the significant technology topics that are utilized in the patent applications of that IoT segment.
- Technology Profile of Top Assignees CPC Group Codes: This table ranks the most significant CPC Group Code / assignee combinations in the IoT segment and thus provides an indication of the significant technologies of focus for the various assignees of patent applications in the IoT segment profiled.
- Technology Profile of Assignee-Sorted, Top Assignees CPC Group Codes: This is a vertically-oriented heat map of the CPC Group Code / assignees combinations of the previous table and shows a more concise list of the technology areas of focus for the listed assignees.
- Technology Profile Heat Map of CPC Group Codes vs. Markets: This table shows how different CPC Group Codes are utilized across the six markets and indicates areas of frequent usage and areas of infrequent usage.
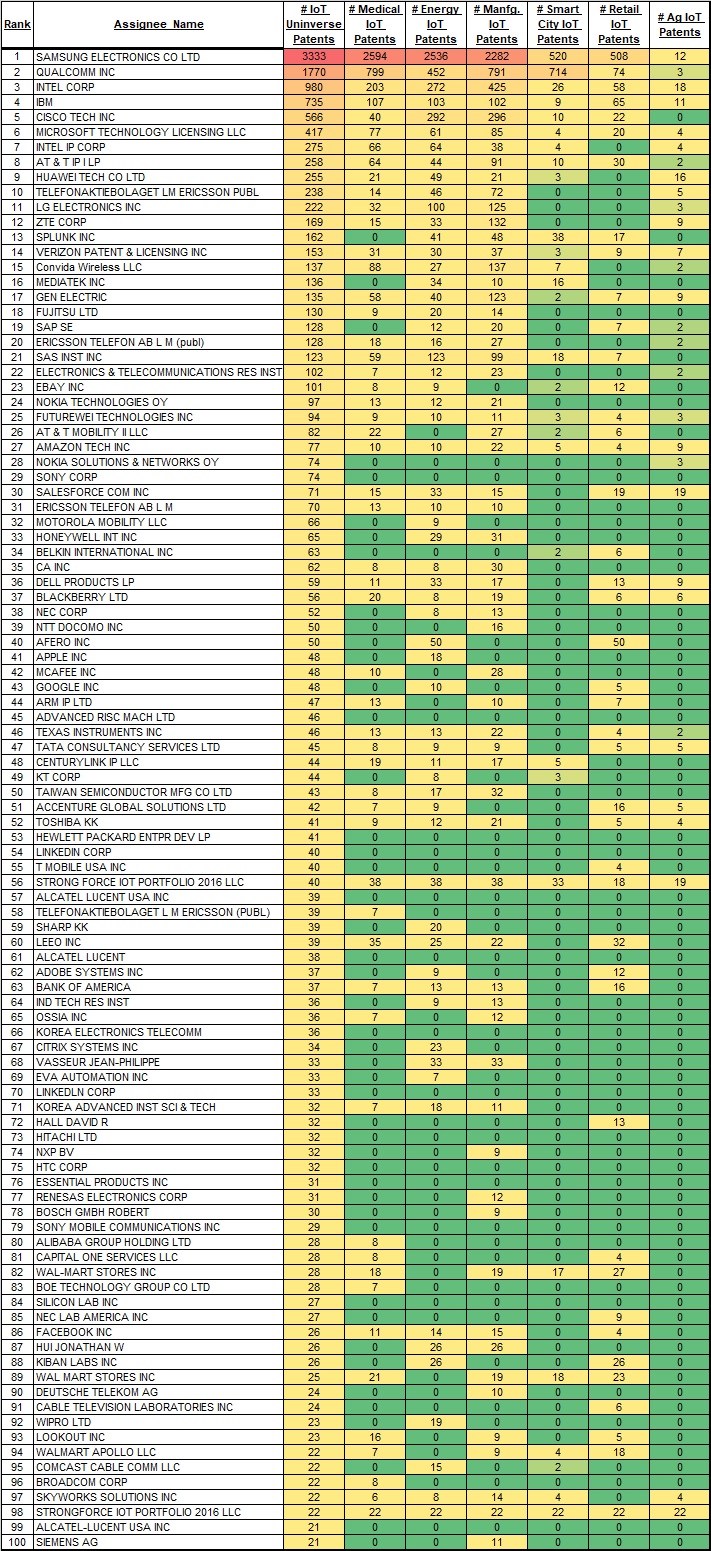
- Market Profile Heat Map of Assignees vs. Markets: This table shows the markets that were referenced in the top 100 assignees list and thus provides an indication of the focus markets for the assignees. This table integrates information from the U.S. IoT Universe and the six market segments.
2.4 Inventor Conclusions:
- Overall, the most prolific inventors come from Qualcomm, with its inventors taking 18 of the top 20 spots on IoT Universe Top Inventors and Predominant Assignees ranking (see section 6.1). The other two inventors are one from Cisco at the number two spot and one from Intel at number 20.
- Somewhat ironically, the most prolific inventors from Samsung only show at the overall ranking of 44 and below. Samsung, as is presented in the assignees section, is the most prolific overall assignee of IoT patent applications. Qualcomm, it seems, has its patent filings largely focused with a smaller number of inventors, whereas Samsung has more IoT patent applications overall, but has those spread out among a larger number of inventors.
- Other prolific inventors in the top 50 ranking come from patent holding entities Convida Wireless LLC and Strong Force IoT Portfolio 2016 LLC, as well as companies such as LG Electronics, ZTE Corp, Belkin International, Afero Inc., and Ericsson.
- In the market segments, the top inventor profiles remains largely similar to the overall profile, with inventors from the aforementioned companies, such as Qualcomm and Cisco, dominating the top portions of the lists for Energy, Manufacturing, Medical, and Smart City.
- That said, the agriculture and retails markets have some noteworthy differences in inventor consistency. The agriculture segment is more significantly dominated by inventors from Strong Force IoT Portfolio 2016, with the next most-significant inventors having approximately 25% of the number of applications compared to the Strong Force inventors. The retail segment has an inventor from Afero Inc. as its top inventor with an inventor from Wal-Mart placing at a solid third. Strong Force inventors also makes a significant showing on the retail segment list.
2.5 Assignee Conclusions:
- Samsung is the top overall IoT Universe assignee with 3,333 patent applications assigned to it, nearly twice as many as the runner-up assignee, Qualcomm. Qualcomm, in turn, has 1,770 patent application assignments, approximately 500 more than the third-placed assignee, Intel Corporation with 1,255 (908 assigned to “Intel Corp” and “275 assigned to “Intel IP Corp”). IBM and Cisco maintain the 4th and 5th rankings with 735 and 566 patent application assignments each. See section 6.3.
- Overall, IoT Universe patent application assignments are heavily concentrated with the top three assignees, Samsung, Qualcomm, and Intel, with the assignment count falling off 83% just within the top five assignee rankings.
- The true assignees and even the ranking of assignees can be clouded by issues such as assignments to IP holding subsidiaries, the assignment to multiple entities, and the spelling or misspelling of assignees in patent filings. Many companies create separately-named subsidiaries for holding and managing IP assets. Additionally, since patents and applications can be assigned to multiple entities it’s quite possible that any particular IP asset could be assigned to both the main corporate entity and the IP holding subsidiary, and thus somewhat distort cumulative patent assignment counts. Some entity names are also just simply alternative spellings or misspellings of the regular corporate name on patent filings. Intel Corp, as noted earlier, is just one example with an IP holding subsidiary. Examples of alternative spellings on the IoT Universe Top 100 list include Strong Force IoT Portfolio (“STRONGFORCE IOT PORTFOLIO 2016 LLC”, and “STRONG FORCE IOT PORTFOLIO 2016 LLC”), Ericsson (“TELEFONAKTIEBOLAGET LM ERICSSON PUBL”, “ERICSSON TELEFON AB L M (publ)”, “TELEFONAKTIEBOLAGET L M ERICSSON (PUBL)”), Alcatel Lucent (“ALCATEL LUCENT USA INC”, “ALCATEL LUCENT”, “ALCATEL-LUCENT USA INC”) and Walmart (“WAL-MART STORES INC”, “WAL MART STORES INC”, “WALMART APOLLO LLC”).
- Most market segments exhibit similar representation of the assignee leaders such as Samsung, Qualcomm, Intel, IBM, and Cisco, in the top rankings. See section 7.3, 8.3, 9.3, 10.3, 11.3, and 12.3.
- However, there are many other notable assignees with significant representations. In agriculture for example, Strong Force IoT maintains the top ranked position with 41 patent application assignments between its 1st and 4th rankings (“STRONGFORCE IOT” ranked 1st, and “STRONG FORCE IOT” ranked 4th). Acalvio Tech and Salesforce.com tie for 2nd in the agriculture segment with 19 patent applications each. See section 7.3
- In the energy segment (section 8.3), SAS Institute works into the top five at the 5th spot. In manufacturing (section 9.3), Convida Wireless ranks 5th, followed by ZTE Corp of China. Convida Wireless also ranks 5th in the medical segment (section 10.3), followed by Microsoft Technology Licensing at number 6. For the retail segment (section 11.3) Afero Inc takes the 5th ranking followed by Leeo Inc. at 6th. Finally, in the smart city segment (section 12.3) both Splunk Inc and Strong Force IoT have notable representations ranking them in the top five.
2.6 Geographic Distribution Conclusions:
- The geographic distribution of the overall IoT Universe, as represented in the analysis breakdown by inventor (section 6.2) and by assignee (sections 6.4), is dominated by U.S. based assignees and inventors, principally because the universe definition limited the scope of the analysis to patents filed with the USPTO. As explained in sections 2.2 and 3.1, the scope was defined this way to present a more quality-focused analysis and filter out the dramatically high quantity of IoT patents filed in China. In fact, the numerical analysis supports the rational of this universe definition. Referring to the column chart in section 3.1.1, it’s clear that the number of IoT patents filed in China dominate the total worldwide landscape. However, that dominant representation is clearly not represented in patents filed with the USPTO by Chinese assignees or inventors. If the quality of the patents specifically filed in China were actually on par with IoT patents filed in the U.S., Europe, and the remainder of Asia, then one would expect to see that dominant position also represented outside of China. That’s clearly not the case. For example, the table in section 6.4 shows the number of USPTO patent applications filed with Chinese assignees to be only 1,144. That’s only 8% of the number of patent applications filed with U.S. assignees (14,564), and 25% of the number of patent applications filed with South Korean assignees (4,519). A similar result is presented in section 6.3 in regard to inventors.
- So, in general, the geographic distributions for the overall IoT Universe and the market segments are dominated by US based assignees and inventors, and the corresponding ranking counts decline quickly for other countries on the lists. South Korea typically ranks 2nd and China 3rd (albeit with typically 1/10 the number of assignments and inventors as the US).
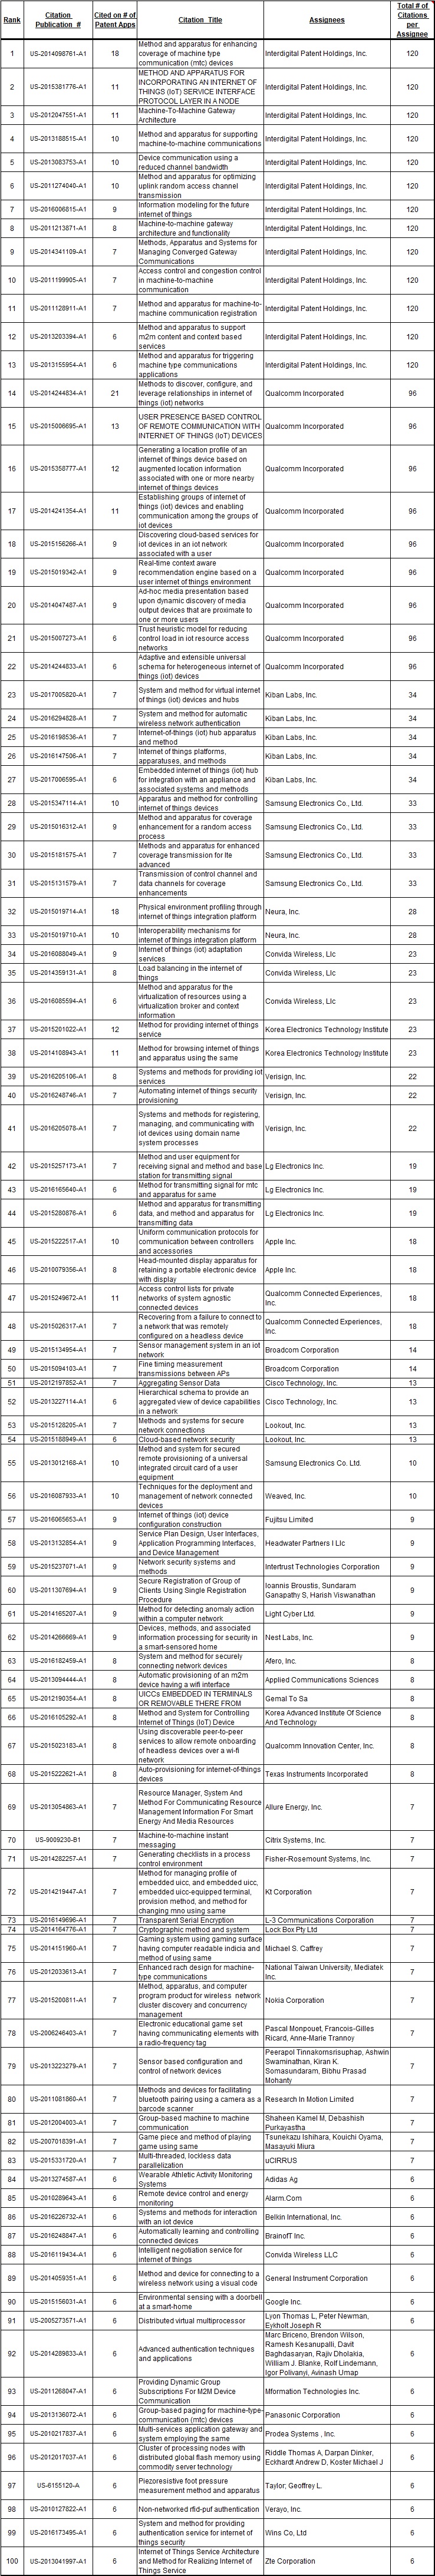
2.7 Patent Literature Citations Conclusions:
- Patent literature citations are presented in two different tables for the IoT Universe and each of the market segments. The first list titled “Top Patent Literature Citations” is a tabulation the most popular patents that are cited across the IoT to universe, as represented in the count of the number of times a patent is cited. The first way of presenting the information shows what patent documents are the most often cited across the IoT universe or the market segments. These patent document citations can be either patent applications or issued patents. These lists generally indicate the most significant patents for the IoT universe or the market segments.
- The second table is derived from the often-cited patents table by grouping by assignee in the tables entitled “Top Patent Literature Citations Sorted by Assignee”. The second way of presenting the information shows which assignees have the most overall often-cited patent documents and is an indication of the significance of an assignees’ intellectual property position.
- The table in section 6.5 shows the ranking of the Top Literature Citations for the overall IoT Universe. This list shows the most often cited patent documents across our universe of 23,046 IoT patent applications. As can be seen from the table, even the most often cited patent documents are not cited all that frequently. For example, the most cited patent document is one by Qualcomm entitled “Methods to Discover Configure and Leverage Relationships in Internet of Things Networks.” This happens to be a patent application citation and is cited on only 21 other patent applications across our entire IoT Universe, a rather small proportion of the entire 23,046 universe of patent documents. However, this small proportion is generally to be expected given the diverse nature of IoT applications. Nonetheless, the patents on this list represent important intellectual property that IoT competitors should be familiar with.
- Section 6.6 shows the same table as in section 6.5 except now sorted by assignee and specifically sorted by the cumulative number of citations across all of the patents that the assignee has ranked in the top 100. So, this table ranks the cited patent documents by assignees and shows the significant patent positions that those assignees have in the IoT universe. The table of section 6.5 shows Interdigital Patent Holdings with the top intellectual property position, with 13 patent assignments in the top 100 that are cited a total of 120 times across the IoT Universe. Qualcomm has the 2nd ranked IP position with 8 patent documents in the top 100, cited 96 times. If assignee “Qualcomm Connected Experiences” is included, then Qualcomm’s total IP position includes 10 patent documents cited 114 times. Interestingly, Kiban Labs Inc. ranks as having the 3rd most significant IP position (ahead of Samsung) with four patent documents cited 34 times. Samsung only has four patent documents in the top 100 that are sited 33 times. Also notable is assignee Neura, Inc., rounding out the top five, with two patents that are cited 28 times.
- In further analyzing the market segments, the diverse nature of IoT applications tends to further dilute the cumulative citation numbers. For example, in Agriculture even the most often cited patent documents, as shown in section 7.5, are only cited two or three time. Similarly, when the citations are sorted by assignee, the total citations per assignee are relatively small. For Agriculture in particular, IBM holds the top spot with three patent documents that are cited a total of 6 times. In the Energy segment (sections 8.5 and 8.6), Qualcomm has the top position, with four patent documents cited 25 times, followed by Apple and Interdigital Patent Holdings. The Manufacturing segment analysis is notable in that the IP position leader is KT Corporation (formerly Korea Telecom), with six patent documents that are cited 30 times, followed by Interdigital and Apple. The Medical segment is led by Apple, with three patents cited 17 different times. Interestingly, Ultrata, LLC, a relative less-known start-up, ranks second in the medical segment with four patents cited 16 different times. IBM round out the top three in medical. For the Retail segment, Qualcomm maintains the top IP position with five patents, cited 19 times, followed by Afero, Inc. (four patents / 14 citations), and Kiban Labs (four patents / 13 citations). Finally, in the Smart City segment, IBM maintains the top IP position (three patents / eight citations), followed by SAS Institute (two patents / six citations), and Cisco (two patents / five citations).
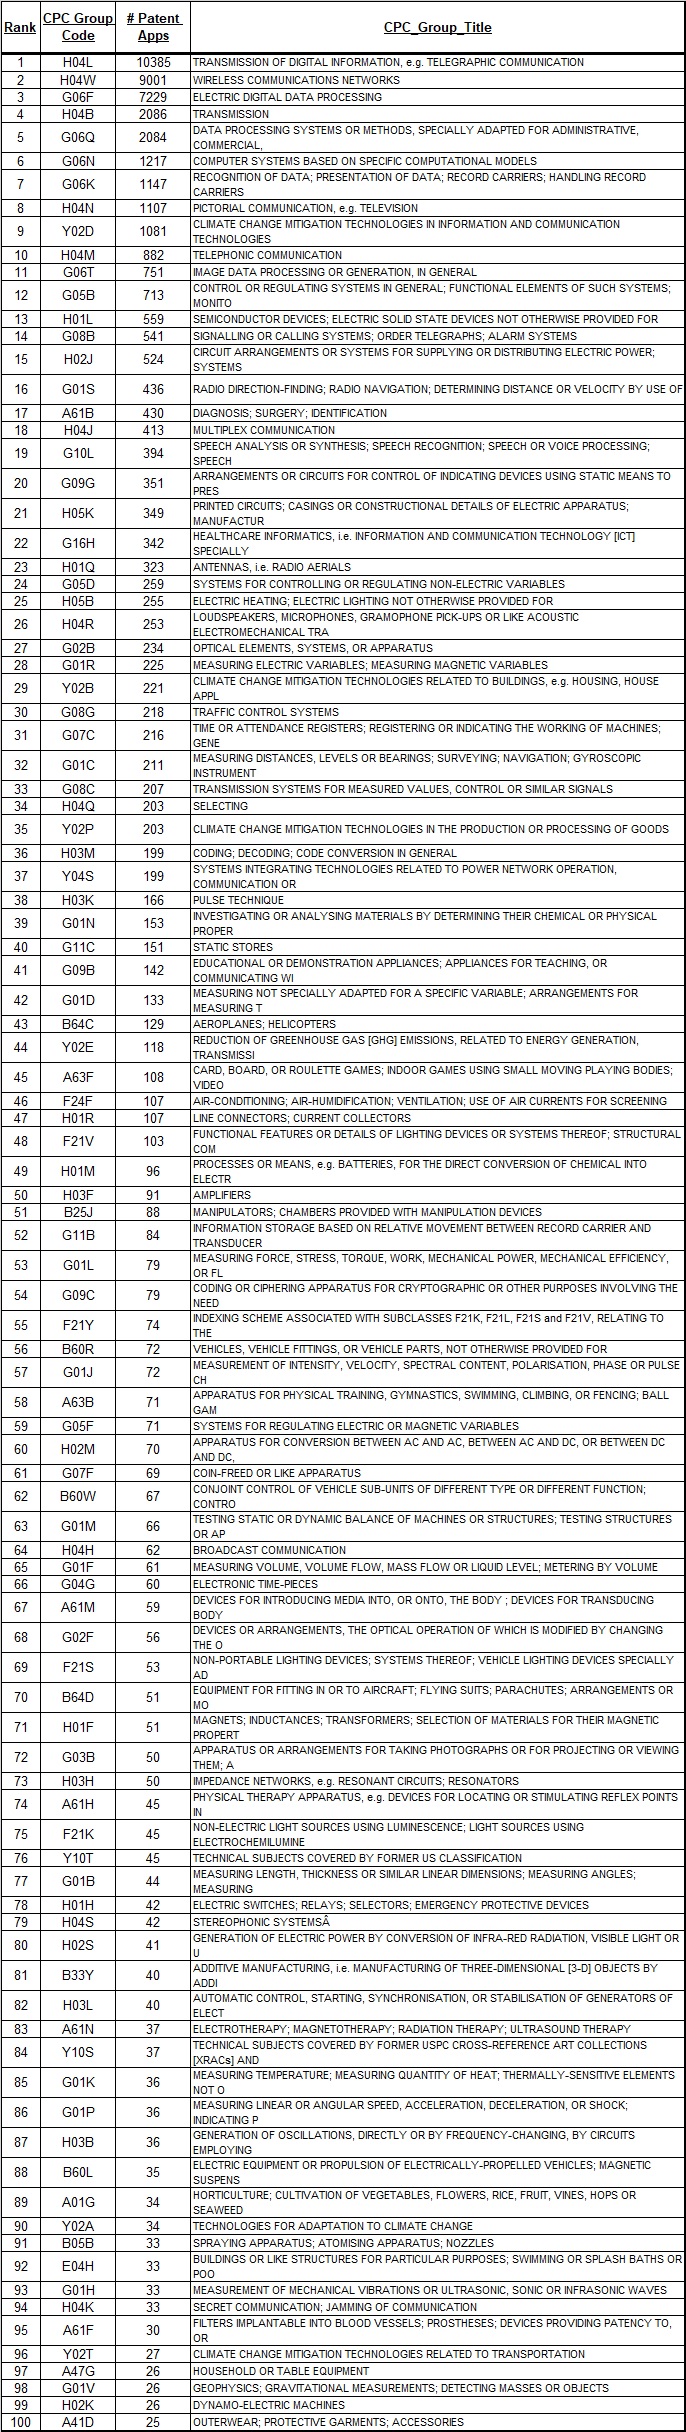
2.8 Technology Profile / CPC Group Code Conclusions:
- The technology profile analysis of the IoT patent landscape is presented in two basic tables. The first, entitled “Top CPC Group Codes” is a tabulation of the frequency of classification codes assigned to the inventive ideas represented in the patent applications. The CPC Group Code titles serve as an approximate description of the technology so that the table concisely displays the frequency with which certainly technological topics are utilized.
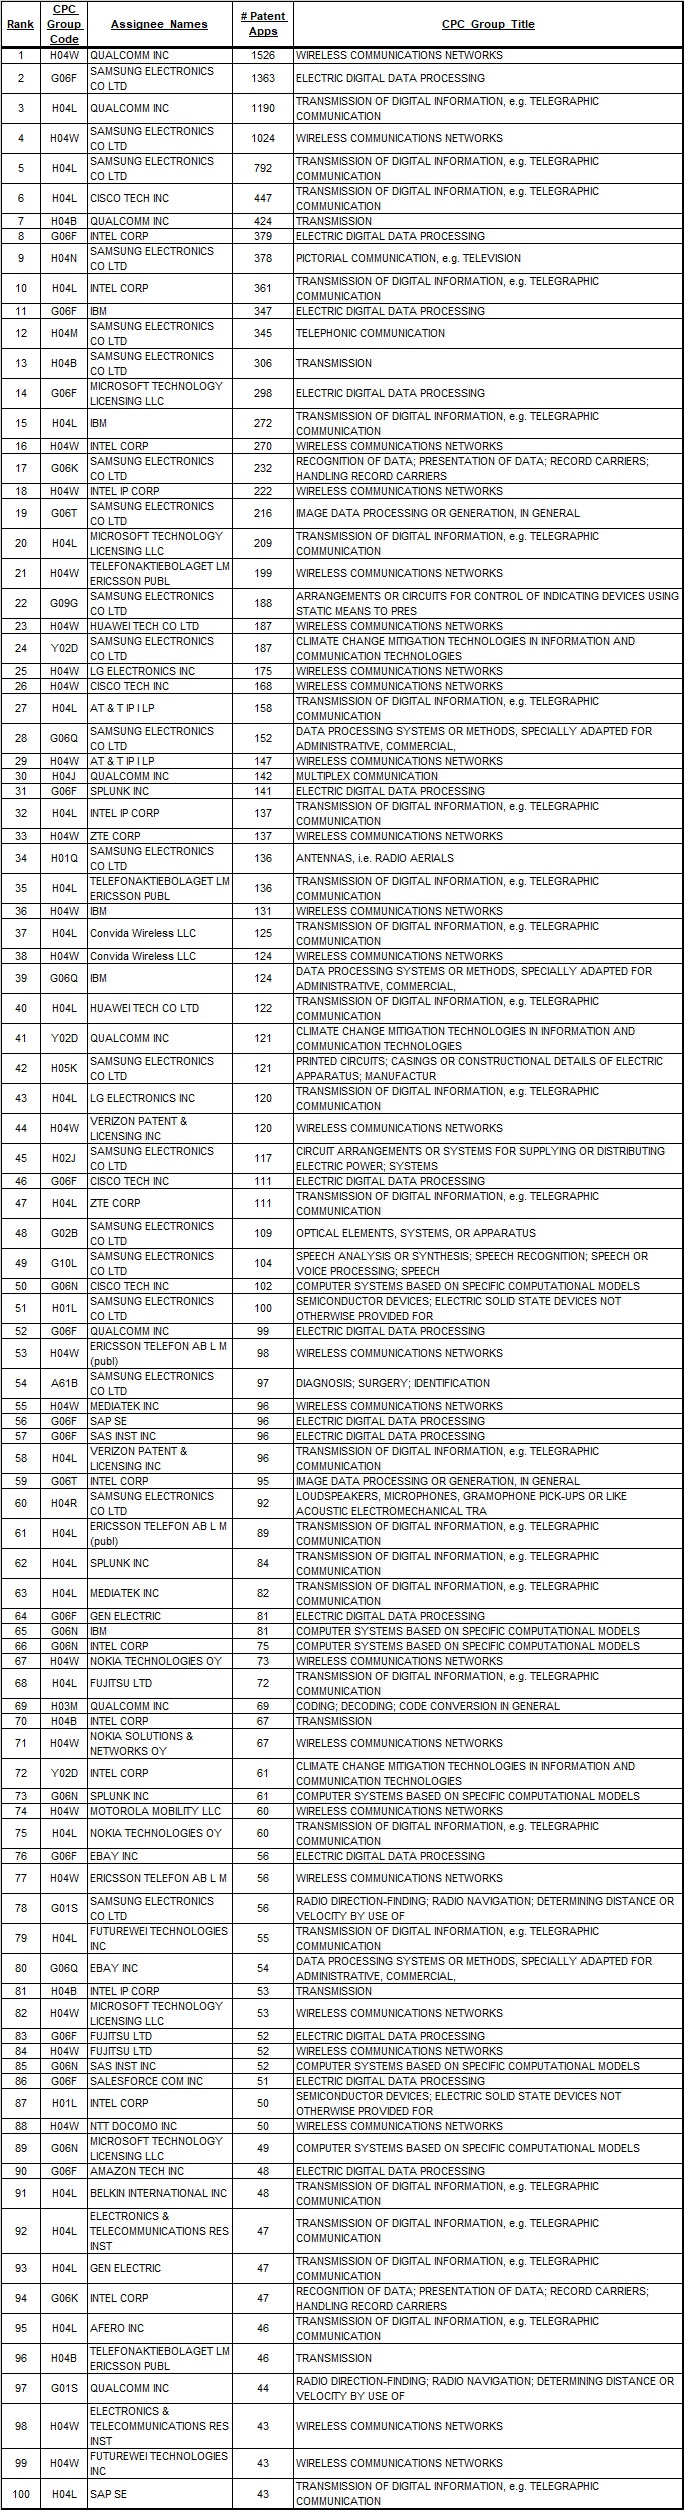
- The second table, entitled “Top Assignee CPC Group Codes” provides a similar CPC Group Code frequency aggregation, but also further subdivides the Group Codes by assignee of the patents, and thus shows the frequency of technological topics that are utilized by each assignee.
- Section 6.7 shows the Top CPC Group Codes for the IoT Universe. The frequency of Group Code technology topics is significantly weighted toward the top five technology areas to the extent that the 6th ranked Group Code has a frequency of use only 12% of the top ranked Group Code. Furthermore, those top ranked technology topics are all more specifically communications hardware related, with Group Code titles such as “Transmission of Digital Information, e.g. Telegraphic Communication”, and “Wireless Communications Networks”. That’s not so surprising given the fundamental importance of communications in IoT applications and correlates with the companies in the top assignees list such as Qualcomm and Samsung.
- But the table of section 6.7, and the similar tables for the market segments, tend to be important not necessarily for what’s at the top of the list, but rather for what’s nearer the bottom or absent from the list, as these observations can be significant starts for a more detailed ‘white-space’ analysis indicating opportunities for future innovation. For example, the Group Code corresponding to “Climate Change Mitigation Technologies in Information and Communications Technologies” ranks rather high at 9th in the table (assigned to 1,081 patent applications). While a closely related technology topic corresponding to the Group Code titled “Climate Change Mitigation Technologies Related to Transportation” only ranks at 96th in the table (assigned to 27 patent applications).
- Section 6.8 shows the Top Assignee CPC Group Codes for the IoT Universe, and similar to the previous table shows that companies like Qualcomm, Samsung, Cisco, and Intel dominate the top CPC Group Code positions all with mostly communication hardware related technology topics.
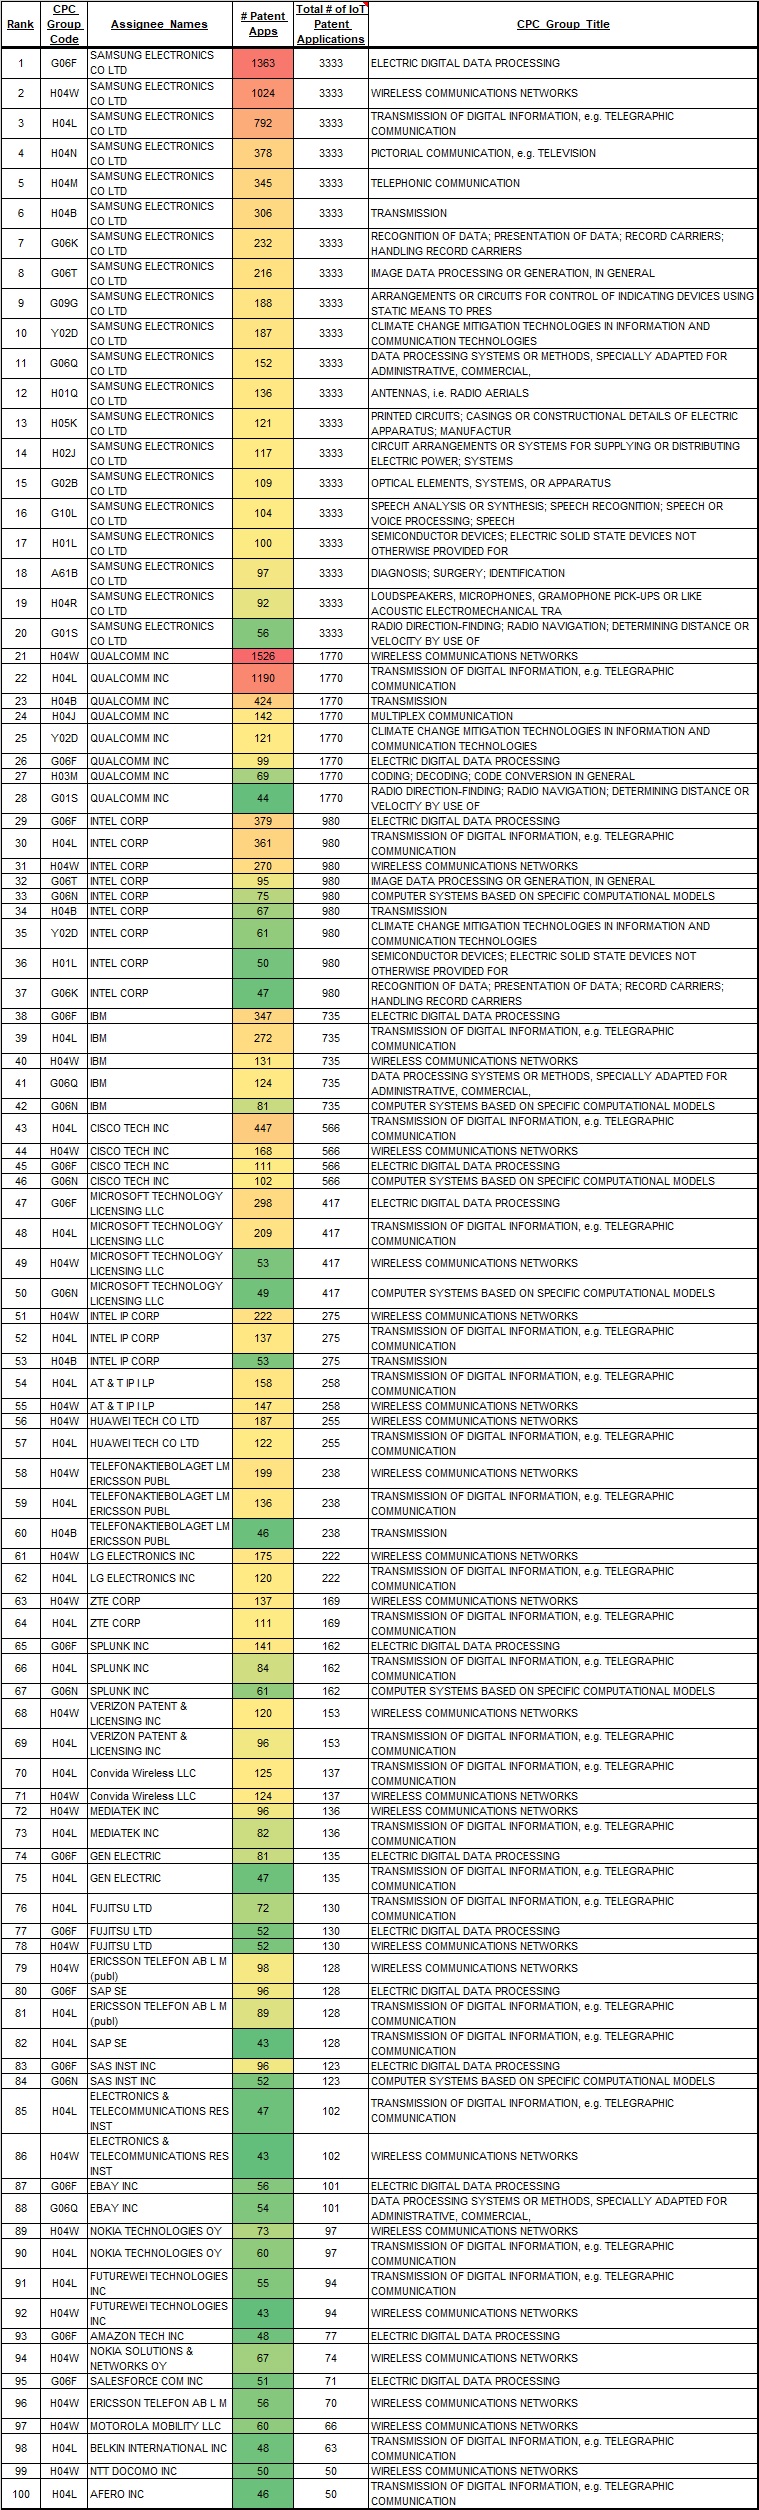
- The table of section 6.9, entitled “Technology Profile of Assignee-Sorted, Top Assignees CPC Group Codes” is a derivation of 6.8, and groups the information by assignees and then color codes the frequency of CPC Group Code assignments (# of Patent Apps) to indicate relative concentrations between assignees of the corresponding CPC Group Code topics. This is essentially a vertical heat map showing the concentration of Group Codes by assignees in the various technology topics and indicates the breadth of technology presence that each assignee has in the IoT Universe.
- From the table of section 6.9 we can see that Samsung not only has the most IoT patent applications, but it also has a very high concentration (indicated by the darker red color) in three Group Codes entitled “Electric Digital Data Processing”, “Wireless Communications Networks”, and “Transmission of Digital Information, e.g. Telegraphic Communication”. In addition, it has the most diverse patent application portfolio across the widest variety of technology topics. Qualcomm has the second most IoT patent applications but is much more concentrated in just two technology topics, indicated with darker red in the topics of “Wireless Communications Networks” and “Transmission of Digital Information, e.g. Telegraphic Communication”. No other assignees have technology topic concentrations that rank in the high concentration red-hued heat map colors.
- For the market segments analysis, the CPC Group Code rankings remain similar to the overall IoT Universe, where the lists are dominated by communications hardware related technology patent applications from the leading assignees such as Samsung, Qualcomm, and Intel.
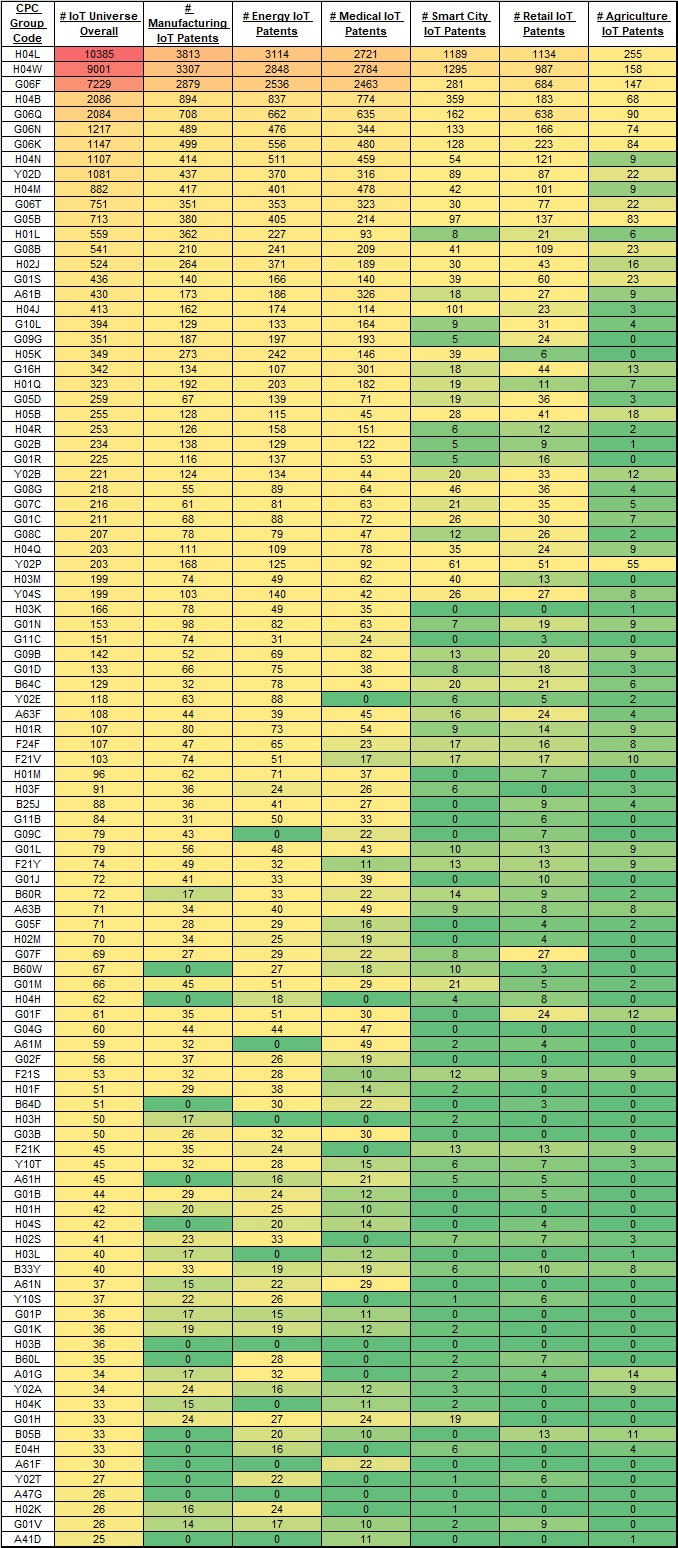
- Examining the market segment lists in more detail, however, other technology profile trends can be observed. For example, image processing related Group Codes such as “Pictorial Communication, e.g. Television” (Group Code H04N) and “Image Data Processing or Generation” (Group Code G06T) show more prominently in Energy, Manufacturing, and Medical. Group Codes related to climate mitigation technologies also rank relatively high in those same market segments, as well as in the Agriculture market segment. Also interesting is the Group Code entitled “Computer Systems Based on Specific Computational Models” (Group Code G06N) which ranks relatively high in all the IoT market segments, and typically encompasses data science related technologies such as analytics, artificial intelligence, and machine learning.
- The table in section 6.10 entitled “Technology Profile Heat Map of CPC Group Codes vs Markets” shows a true heat map of the top 100 technology CPC Group Codes for the IoT Universe versus the market segments. The heat map is organized so that the most frequent Group Codes are at the top. Only the four-character CPC Group Code is used in the table, but table 6.7 can be used to lookup the Group Code title. This is an interesting pictorial representation of the concentration of technology topics applied in the market segments. With this table it’s easy to observe the high frequency applied technologies and markets (red and orange hued colors) versus the lower frequency or altogether absent application of technology applied in other markets (green-hued colors). As a result, this table can be a nice starting point for a ‘white-space’ analysis designed to uncover opportunities for innovation and new patent applications. A more detailed white-space analysis is typically required to more specifically identify the technologies and market applications to pursue.
2.9 Assignees vs. Markets Heat Map Profile Conclusions:
- The table in section 6.11 entitled “Market Profile Heat Map of Top 100 Assignees vs. Markets” shows the market presence of the patent applications of the top 100 assignees. The heat map is organized so that the assignees are organized in decreasing order, top to bottom, based on the number of patent applications in the IoT Universe. In this table it’s easy to observe the market presence of the patent applications of the top 100 assignees and provides an indication of the application areas on which the companies are focused. Samsung is the assignee leader and has a diversified patent application presence in every market segment. Qualcomm, Intel, IBM and Cisco round out the top five, all also with relatively diverse presence across the market segments.
6.1 U.S. IoT Universe: Top 100 Inventors and Predominant Assignees
6.2 U.S. IoT Universe: Number of Inventors by Country
6.2.1 U.S. IoT Universe: Heat Map-Number of Inventors by Country
6.3 U.S. IoT Universe: Top 100 Assignees and Assignee Country
6.4 U.S. IoT Universe: Number of Patent Application Assignments by Country
6.5 U.S. IoT Universe: Top 100 Patent Literature Citations
6.6 U.S. IoT Universe: Top 100 Patent Literature Citations Sorted by Assignee
6.7 U.S. IoT Universe: Technology Profile of Top 100 CPC Group Codes
6.8 U.S. IoT Universe: Technology Profile of Top 100 Assignee CPC Group Codes
6.9 U.S. IoT Universe: Technology Profile of Assignee-Sorted, Top Assignees CPC Group Codes
6.10 U.S. IoT Universe: Technology Profile Heat Map of CPC Group Codes vs. Markets
6.11 U.S. IoT Universe: Market Profile Heat Map of Top 100 Assignees vs. Markets