
Internet of Things (IoT) Patent Landscape Presentation - 2019 IoT Fuse Conference
James H. Moeller
September 20, 2019
(Approximate Read-Time: 25 minutes)
(Approximate Read-Time: 25 minutes)
The following is the IoT patent landscape presentation and accompanying comments presented at the 2019 IoT Fuse Conference in Minneapolis, Minnesota.
2019 IoT Fuse Conference Presentation:
Reference Report Results Summary:
Full Reference Report:
Disclaimer:
- This is an overview presentation on an IoT patent landscape.
- I’m not going to cover any in-depth legal information.
- Nonetheless, a presentation such as this wouldn’t be complete without the standard disclaimer. So don’t interpret anything in this presentation as legal advise or as a substitute for consultation with legal advisors.
- In fact, what you’ll see in this presentation is a very high-level overview of the patent information for IoT and a slightly more detailed break-down into six select market areas.
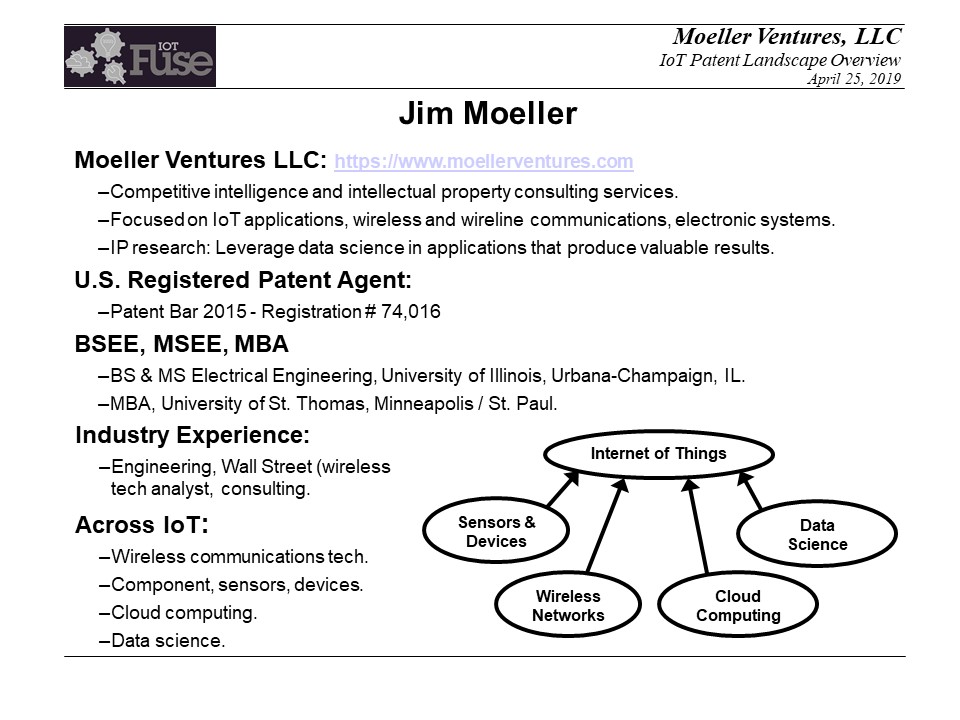
About Jim Moeller:
- I run my own consulting business focused on competitive intelligence and intellectual property research, covering domains such as IoT, wireless and wireline communications, and electronics systems.
- I’m also a registered patent agent, but focusing on the research and strategic intelligence aspects of intellectual property, as opposed to the filing and prosecution of patents at the USPTO.
- In addition, in regard to patent and IP research projects, I also typically incorporate a pretty significant level of data science into the processing and interpretation of the results. It’s becoming easier to do this via resources such as Google’s BigQuery and the public patent database provided through BigQuery.
- Finally, over the course of my career, I’ve worked in pretty much all the various domain areas that make up the Internet of Things application trend, so I have a good perspective on all those technologies.
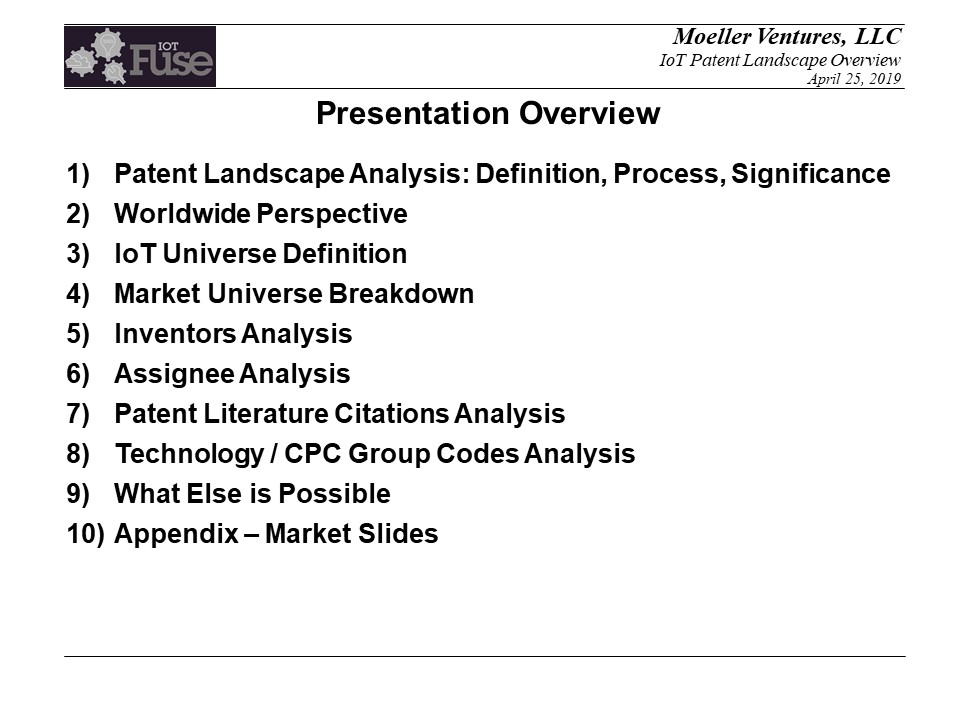
Presentation Overview:
- This is the presentation overview.
- Sections 1 through 4 cover a brief definition of patent landscaping, why we care about executing a patent landscape, and how I defined the universe of patents that I analyzed for this presentation.
- Sections 5 through 8 is the core of the landscaping results analyzing inventors, assignees, notable patent citations, and a breakdown of the applicable technologies via CPC code.
- Section 9 is a quick list of other types of patent landscaping and patent analysis.
- Section 10 contains 30 additional slides, 5 slides for each of the six different markets for which I’ve subdivided this analysis.
- As you’ll see, I’ve subdivided this analysis into six markets – Agriculture, Energy, Manufacturing, Medical, Retail, and Smart City, according to the market segmentation used by the IoT Fuse Conference.
- For each market I present 5 additional slides – Inventors, Assignees, Key Patent Literature Citations, Key CPC Group Codes, and Key CPC Group Codes by Assignee.
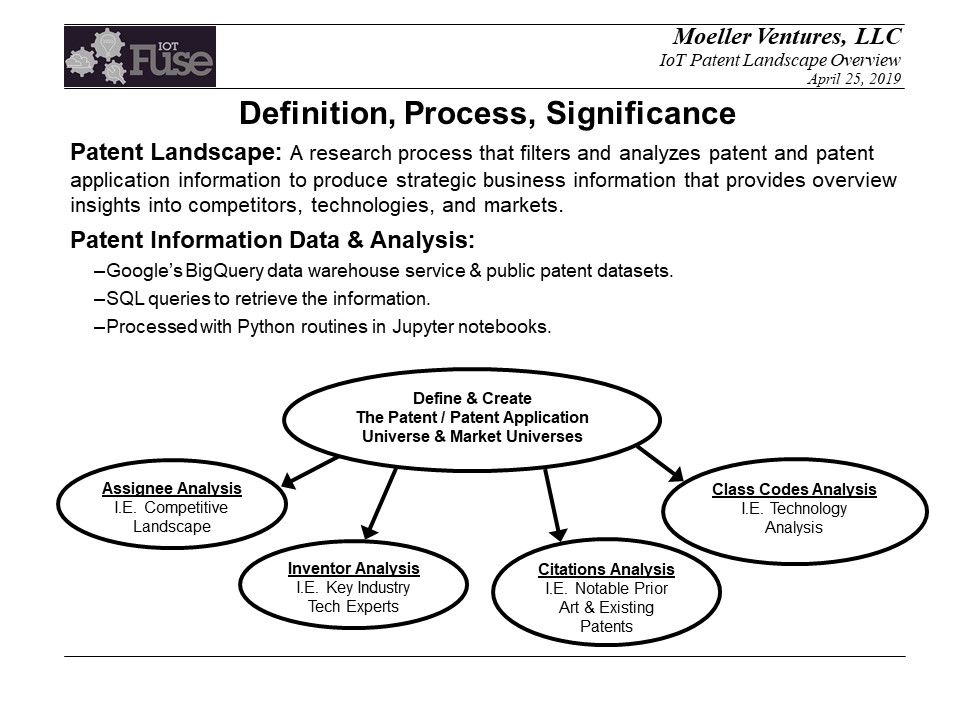
Definition, Process, Significance:
- So what is a patent landscape?
- In general this is a process that analyzes patent information and attempts to extract strategic business information in regard to competitors, technologies, and markets.
- There are many different way to execute patent landscapes.
- For the analysis that I’ve executed here, I’ve utilized Google’s BigQuery data warehouse service, which is part of Google’s cloud offering, as well as the patent datasets that are provided through BigQuery. The patent datasets in BigQuery are provided by IFI Claims. BigQuery and the patent datasets truly enable this type of analysis and integration into data science platforms, such as what I’ve done here using Python programmatic analysis in Jupyter notebooks.
- The diagram shows the general process I’ve used, where I start by defining and creating the universe of patent applications that I’ll analyze and then break-out information associated with those patent applications, according to assignees (competitive landscape), inventors (key tech experts), citations (notable patents), and technology class codes (technology analysis).
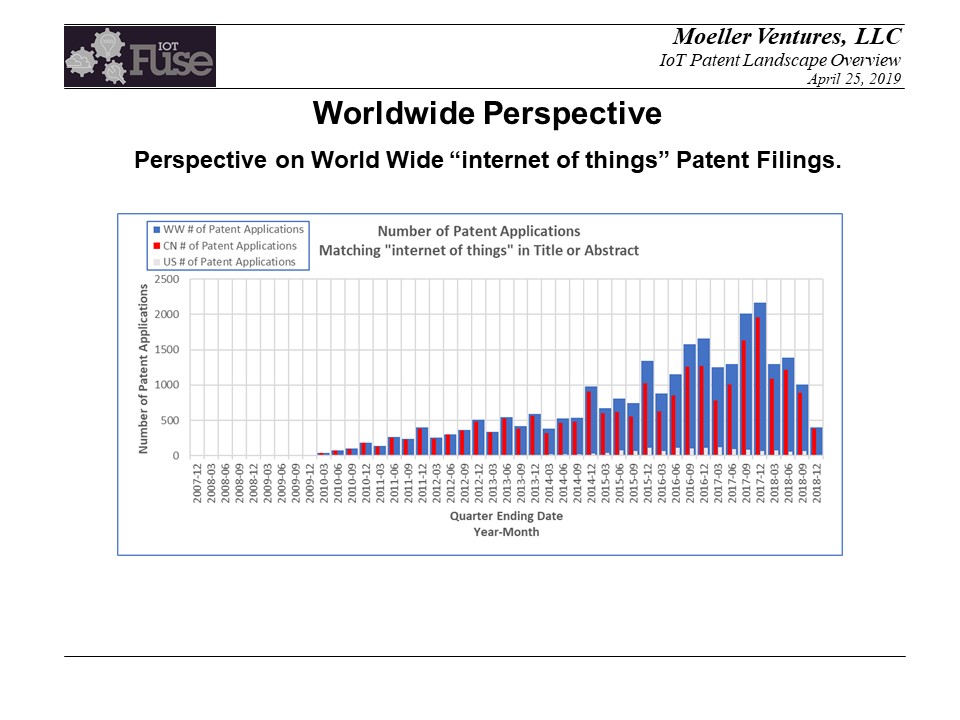
Worldwide Perspective:
- The first thing I wanted to do was to get a broad understanding of the Internet of Things, via a worldwide search. Google’s database contains bibliographic information (which includes abstracts, but not full text) on over 76 million patent documents worldwide and full text information on over 13 million U.S. patent documents.
- I decided to use the exact phrase “internet of things”, hyphenated and not, and case insensitive.
- It’s certainly debatable that other phrases like “machine-to-machine” or “M2M” should also be included in this high-level keyword filter, however my analysis shows that “internet of things” really focused on the patents representing the current IoT trend.
So, “internet of things” is what I used as my high-level filter. - The chart shows the number of patents filed on a quarterly basis, that include “internet of things” in either the title or abstract.
The blue column represents the cumulative worldwide numbers. The red represents the patents filed just in China. And the white represents just the patents filed in the United States. - So the problem is that that “internet of things” patent filings in China distort the cumulative worldwide numbers.
Because of this my analysis will just focus on U.S. patent application filings only.
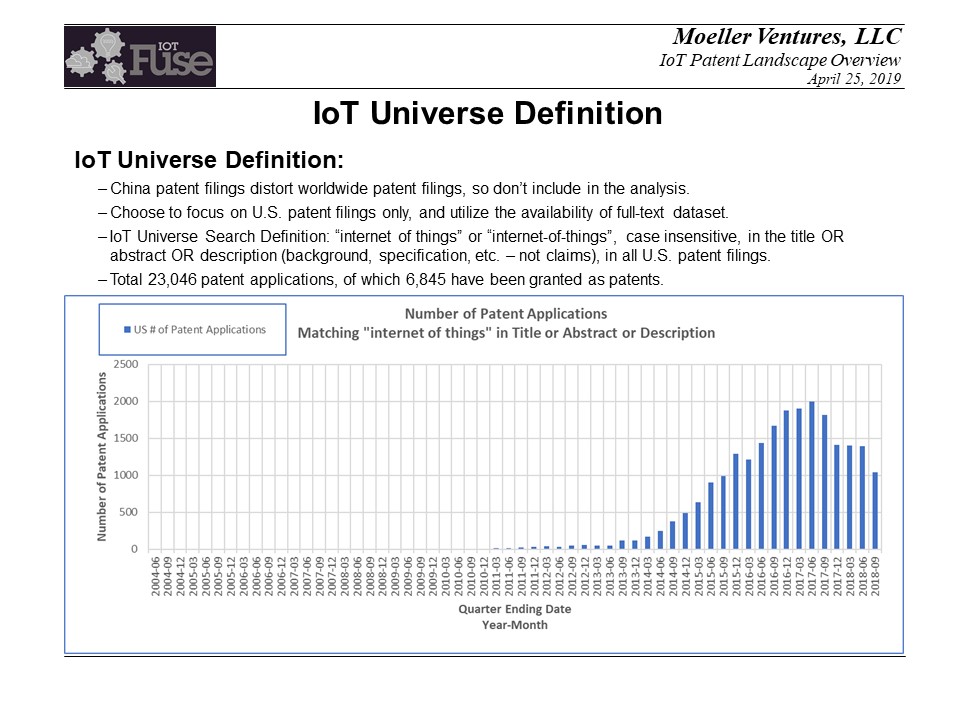
IoT Universe Definition:
- This is my definition of the “internet of things” patent application universe.
- Focus on U.S patent applications and utilize the availability of full-text for U.S. patent documents.
- Search filter is “internet of things” in title, abstract or description (all text except claims).
- Universe includes 23,046 patent applications of which 6,845 have been granted as patents.
- Chart shows the number of patent applications filed on a quarterly basis, and captures the relatively recently Internet-of-Things (IoT) trend.
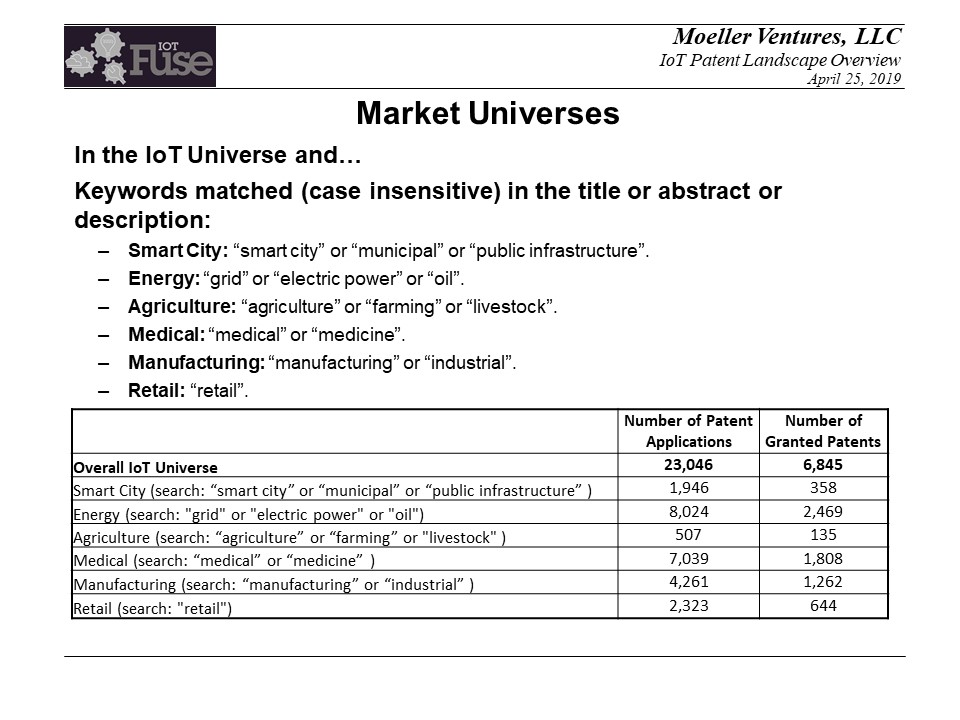
Market Universes:
- I wanted to further divide our universe into market segments.
- I did so via simple keyword search filters as shown on this slide.
- The six market segments selected are simply those used by the IoT Fuse Conference organizers in their description of the market segments for the conference. While IoT can ultimately be divided into market segments many different ways, the six listed here and used by IoT Fuse are what I used in my analysis.
- The tables for the analysis results for each of these market segments are in the Appendix of this presentation.
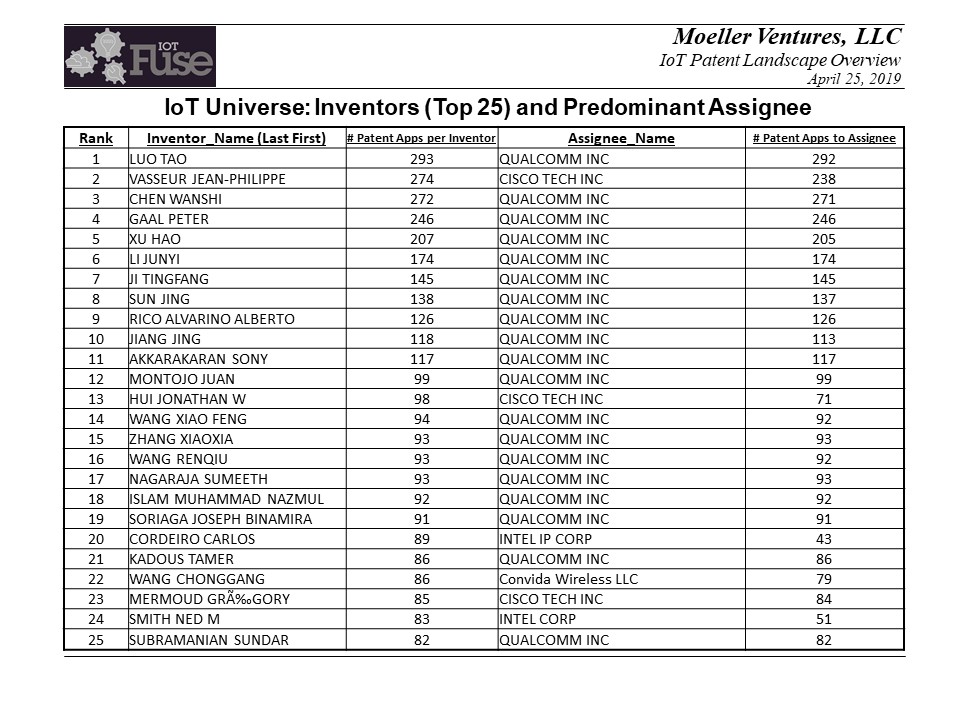
IoT Universe: Top 25 Inventors and Predominant Assignees:
- This lists the top 25 inventors and the predominant assignee.
- This was generated by breaking-out all the different inventors on the IoT universe of 23,046 patents and summing the number of patent applications on which the inventor is listed and also showing the predominant assignee to which that inventor as assigned patents.
- Qualcomm inventors have a very concentrated presence. Samsung is also a significant assignee (as seen on the next slide), but looks to have it’s inventions spread over a much larger number of inventors.
- Note Intel IP Corp vs Intel Corp. Many companies will setup separate business units specifically for their intellectual property.
Note Convida Wireless LLC, which is a Sony – InterDigital joint venture, patent holding company.
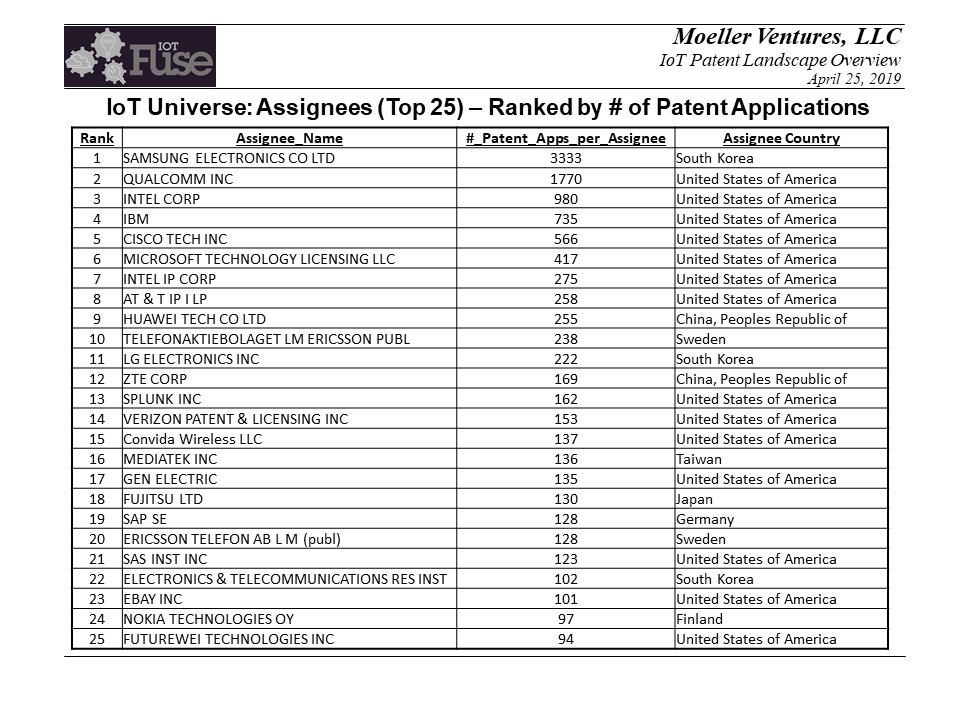
IoT Universe: Top 25 Assignees:
- Samsung and Qualcomm dominant assignees.
- Companies with separate IP holding businesses – Microsoft, AT&T, Verizon.
- Chinese companies – Huawei(Futurewei is Huawei's U.S. group), ZTC.
- Note: Ebay at #23, maybe not a typical IoT company, but a patent application presence nonetheless, most likely with cloud IoT technology, as we’ll see later with the technology CPC classification codes.
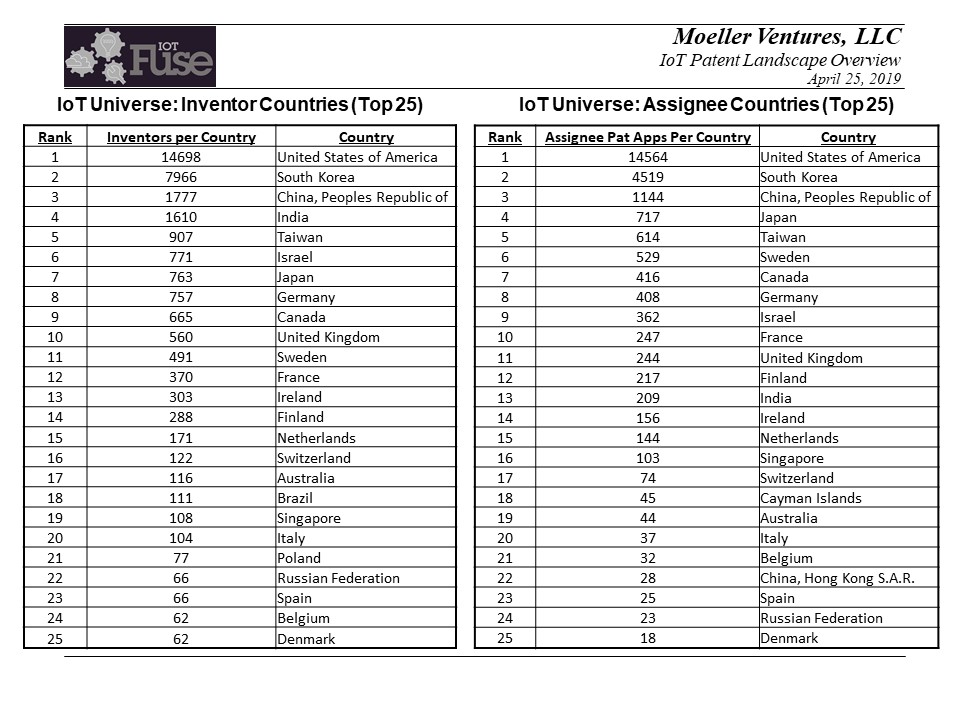
Geographic Breakdown:
- Top 25 inventor countries.
- Top 25 assignee countries.
- Mostly as expected, with the U.S. as the dominant inventor and assignee patent filer.
- Note: South Korea, largely Samsung filings.
- Note: Chinese patent filings in U.S. not nearly as significant presence as what is represented in their own domestic filings.
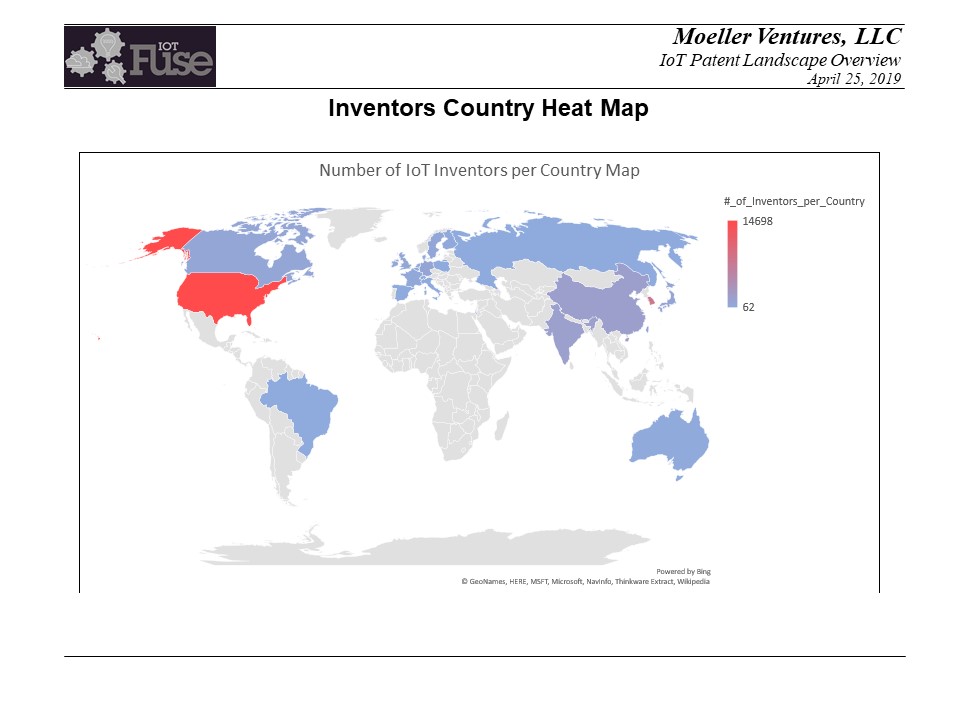
Geographic Breakdown Heat Map:
- Heat map visual of the information represented in the previous table.
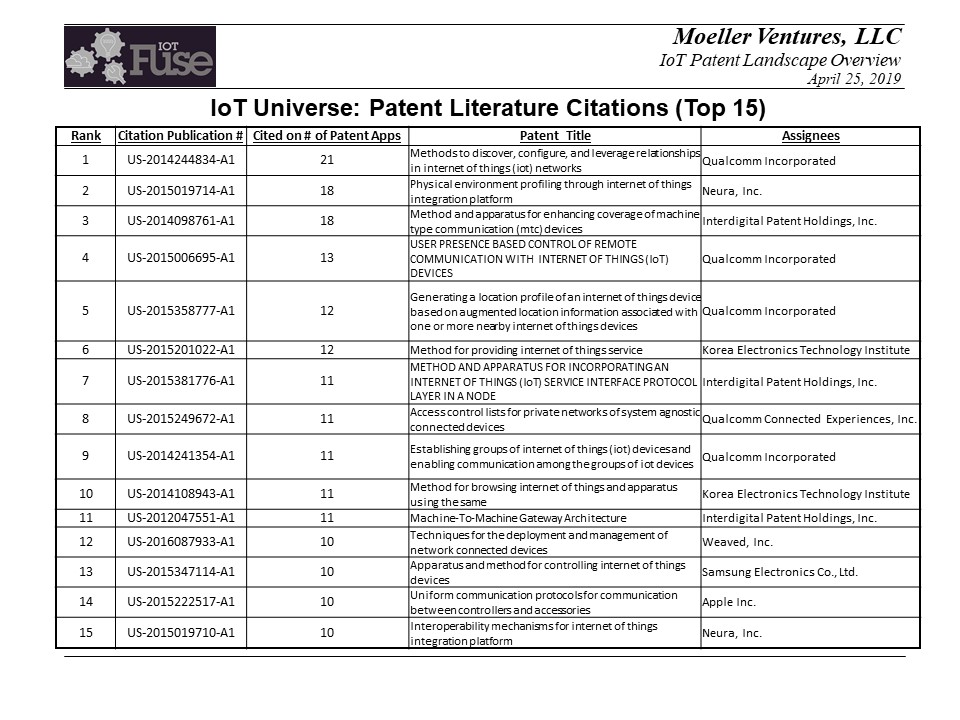
IoT Universe: Top 15 Patent Literature Citations:
- This list was derived by breaking out all the patent literature citations and then totaling the number of times a citation was referenced.
- The intent here is to identify any patents that are frequently cited across our IoT universe. These could be important patents.
Doesn’t necessarily show a dominant patent across our universe of 23,046 patents. That’s pretty much as expected given the diverse nature of the IoT application trend. - This type of analysis can change as the analysis focus get narrower, by market, by technology, etc.
- Note: Qualcomm presence, as expected. InterDigial presence. Qualcomm Connected Experiences, Inc.
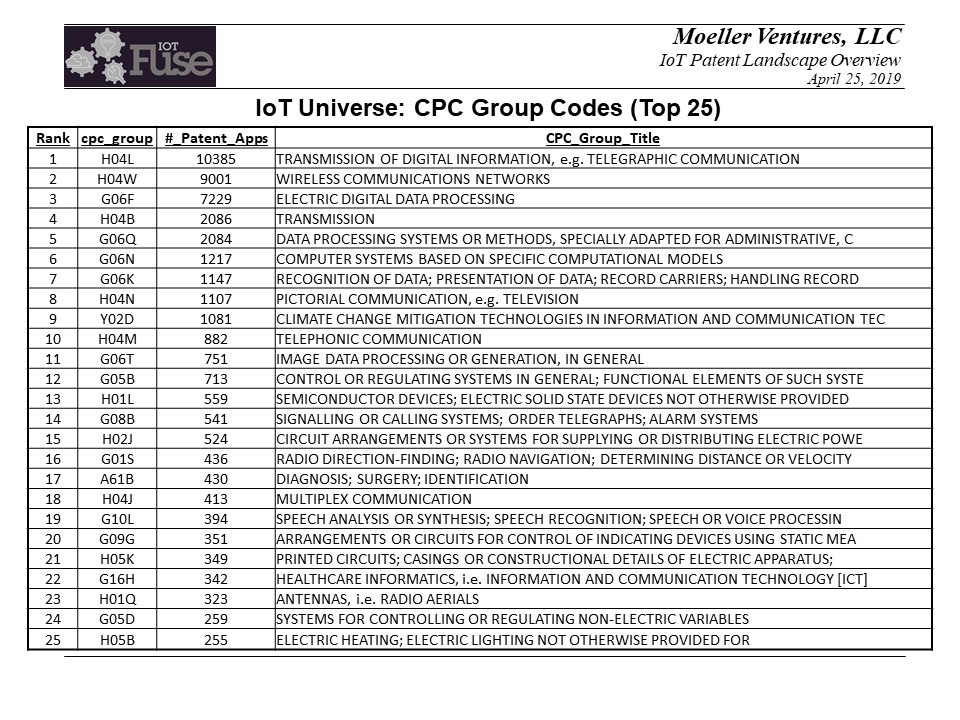
IoT Universe: Top 25 CPC Group Codes:
- CPC (Cooperative Patent Classification) codes are a multi-letter classification system used by the USPTO to organize patent and applications.
- The first four characters of the CPC code constitute the CPC Group code. These CPC Group codes provide a good overview indication as to the technology classification into which patent application inventions fall.
- Each patent application can have multiple CPC codes corresponding to the different inventive ideas represented in the patent application.
- This list was generated by breaking out all the CPC group codes and then totaling the number of times the CPC Group codes was used.
- This shows the breakdown of the type of technologies that are used across our IoT universe.
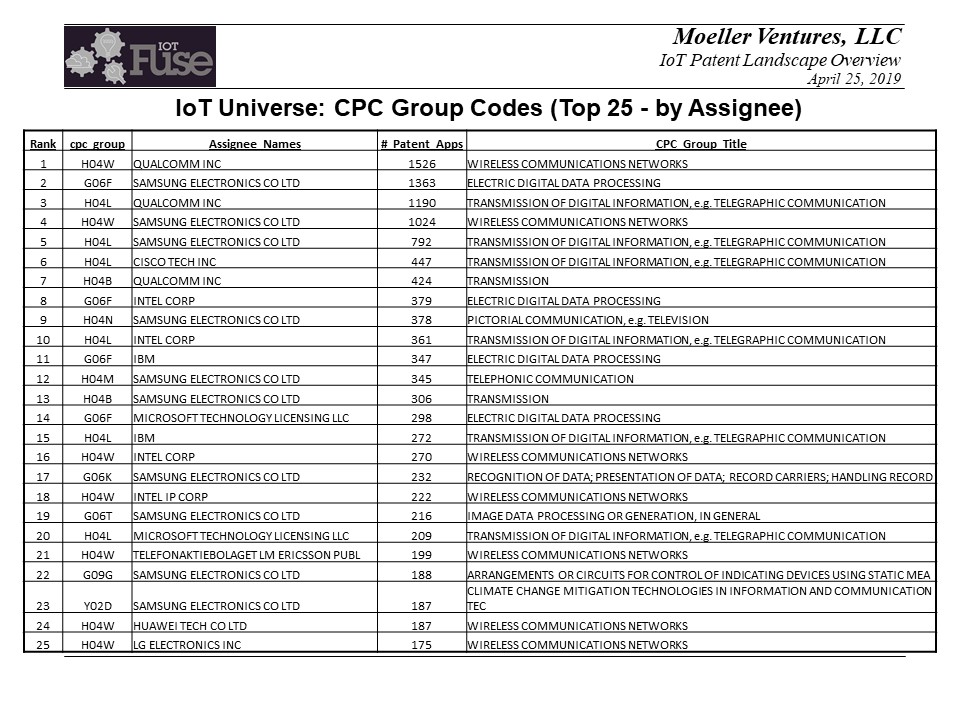
IoT Universe: Top 25 CPC Group Codes by Assignee:
- This list was generated by breaking out the CPC group codes according to assignee and then totaling the number of patent apps for each group-code-by-assignee.
- This list essentially shows the technology presence of individual companies.
- It show the technology areas that these individual companies file patents in most frequently in the IoT application universe.
Again this type of list can get considerably more interesting as the patent landscape analysis focus narrows.
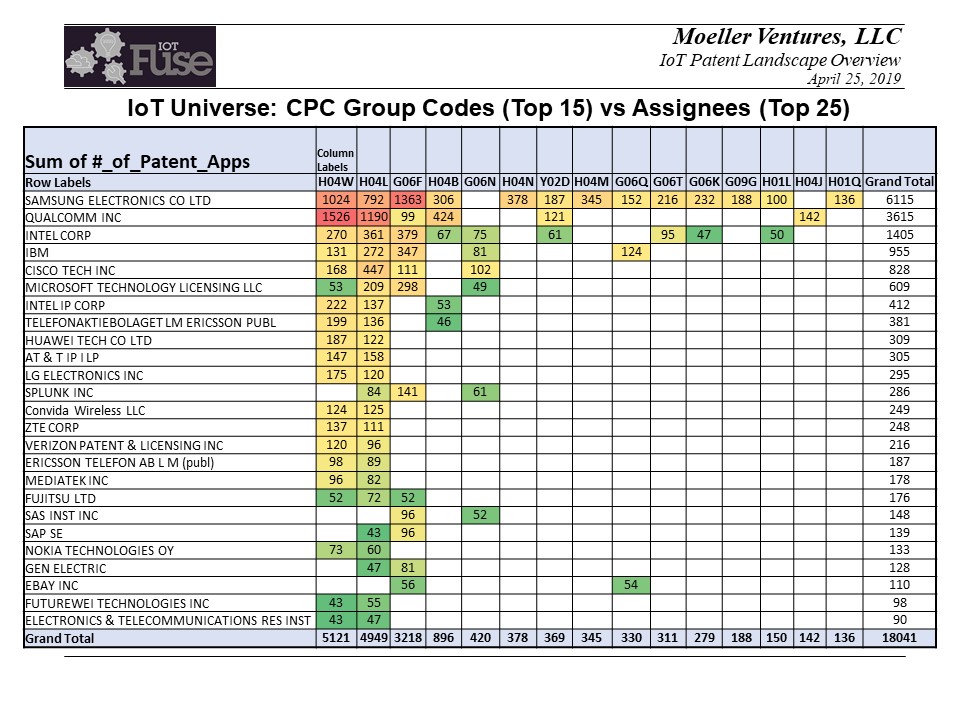
IoT Universe: Heat Map of CPC Group Codes vs Assignees:
- Visual representation of the data in the previous table.
- Samsung has a broader patent presence across more technology areas.
- Intel also has a relatively broad patenting presence.
- Qualcomm is much more focused in the core wireless technology areas.
- This heat map and the information on the next slide become useful in another type of patent analysis called a “White-Space” search.
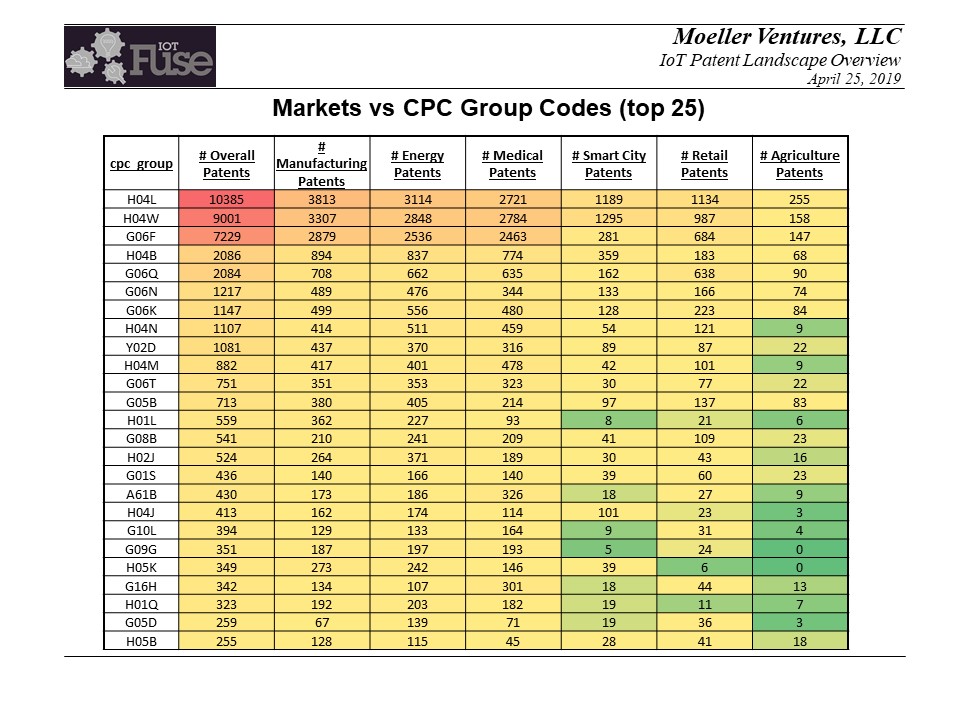
Markets vs Top 25 CPC Group Codes:
- This shows a heat map visual of the top 25 group codes of the IoT universe and the patent filing frequency of those group codes in the six market segments.
- This essentially shows the technology utilization frequency in the market segments.
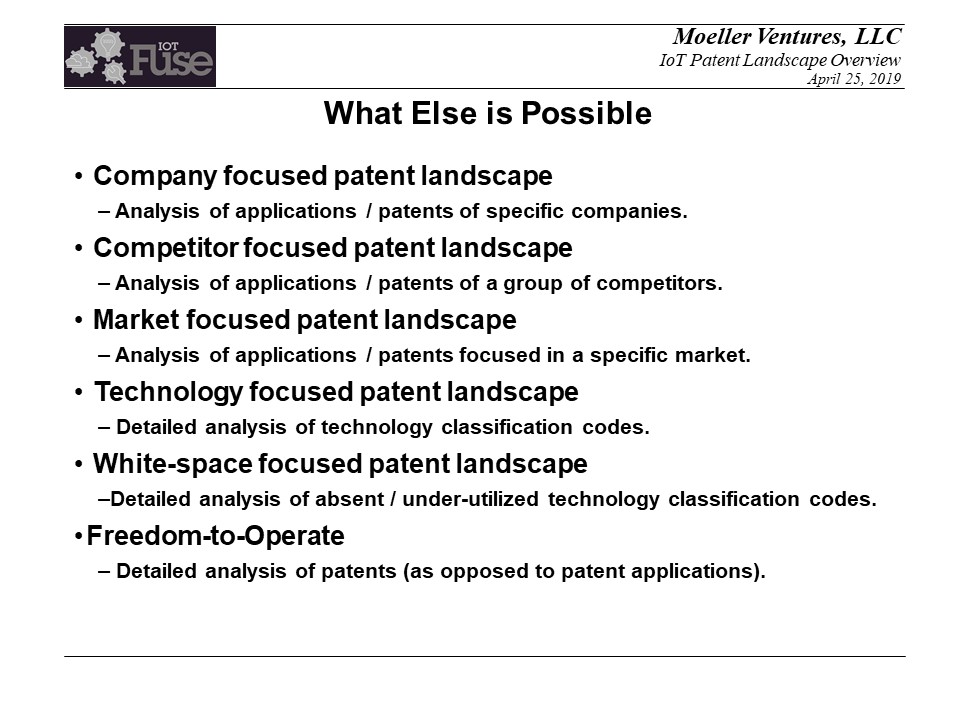
What Else is Possible:
- Similar patent landscaping techniques can be applied in other ways.
- Focusing on specific companies, a set of companies (i.e. competitors), more detailed market focus, more detailed technology focus maybe structured as a white-space search, or maybe focused on just patented technology and structured as a freedom-to-operate analysis.