
A Patent Landscaping Tutorial Using the PatSnap Analysis Tool and CRISPR as the Focus Technology
James H. Moeller - Moeller Ventures, LLC - https://www.moellerventures.com/
June 23, 2022
This report presents a tutorial of a patent landscaping process using the PatSnap Connected Innovation Intelligence platform, that is exemplified via an analysis of the CRISPR-Cas9 gene editing technology. This tutorial is an expanded version of a patent landscaping process that was recently applied to a National Institute of Health (NIH) project as part of providing commercialization assessments to SBIR (Small Business Innovation Research) and STTR (Small Business Technology Transfer) funded companies. The NIH project was executed for a contract awarded to Vikriti Management Consulting where Moeller Ventures served as a subcontractor executing 200 patent landscapes for life science companies.
The patent landscaping analysis proved to be one of the most highly regarded sections of the NIH commercialization assessment project as it provided important intelligence regarding companies’ intellectual property, which is one of the most valuable assets of a life science startup. The expanded process presented in this report provides a more powerful technique to gain insight about and craft patent protection strategy for an IP sector. The six steps of the landscaping process covered in this report are listed below.
Step 1: Create the Domain Collection of Patent Documents
Step 2: Profile the Domain Collection
Step 3: Tabulate the Assignees and Inventors
Step 4: Analyze Citations
Step 5: Analyze Patent Document Technology Classification Codes
Step 6: Use Landscape Diagraming to Explore the Domain Collection
Inquiries regarding custom patent and intellectual property analysis using the PatSnap Connected Innovation Intelligence platform can be directed to the following individuals.
- Jim Moeller, Moeller Ventures LLC,
This email address is being protected from spambots. You need JavaScript enabled to view it. , 651-454-4123 - Jolly Nanda, VIKRITI Management Consulting, Contact: https://vikriti.com/contact-us-2/
- Michele Zoromski, M.ZORO Consulting,
This email address is being protected from spambots. You need JavaScript enabled to view it. , 612-804-4291
Step 1: Create the Domain Collection of Patent Documents
The first step in the patent landscaping process is to create a domain collection of relevant patent documents. There are various techniques that can be used to create this domain collection. For example, keywords and key phrases can be used as queries into worldwide patent databases to find the relevant documents representing topics or technology sectors. This type of text query can match specific text in a patent document title, abstract, description, or claims, with keywords and phrases matched across all sections or sections independently. A domain collection may also simply consist of a specific set of patent documents where the documents’ application or publication numbers are used to query the information about each document. This is typically applied in situations where the specific set of patent documents represents a corporate patent portfolio or maybe a sector focused portion of that portfolio. Domain collections can also be created from database queries of patent document assignee names. The assignee names could be a single corporation, a group of companies representing an industry sector, an educational or research institution, or even individuals that are listed as assignees. Finally, domain collections can be created through the application of machine learning (ML) and natural language processing (NPL) techniques to identify semantically similar patent documents to a seed document or a set of seed documents. Most patent analytics services offer some type of NPL-enabled semantic search capability that enables users to create domain collections via this technique.
Creating a domain collection for CRISPR-Cas9 can be quite difficult as this has been a very active IP sector over the last decade. For example, executing a keyword query via PatSnap and its worldwide patent database using the combination of “CRISPR” logically ANDed with “Cas9” and searching across titles, abstracts, descriptions, and claims, yields 71,398 patent documents. This is far too many for an insightful landscape analysis and likely includes many patent documents that are far removed from the core fundamental CRISPR patents. In attempting to focus the query further, if that same keyword search is executed only on the claims sections of the patent documents, it still yields a collection consisting of 14,203 patent documents, also too large and too broad.
However, the contentious litigation environment that has existed in the CRISPR IP sector provides some help in creating the domain collection. In particular, there has been considerable litigation between two groups that filed early fundamental patents in this IP sector. One group consists of the University of California Berkeley, the University of Vienna, and scientist Emmanuelle Charpentier, who was formerly associated with the University of Vienna. The second group consists of The Broad Institute, the Massachusetts Institute of Technology, and Harvard University. There have been two separate Interference proceedings and subsequent decisions from the USPTO Patent Trials and Appeals Board (PTAB) between these two groups. The first was filed February 15, 2017 and the second was filed February 28, 2022. The second Interference decision lists 28 patent documents, 14 from the Berkeley group (collectively referred to as “CVC” in the Interference decision) and 14 from the Broad Institute group (collectively referred to as “Broad” in the Interference decision). These patent documents are listed in exhibit 1 below and constitute a nicely focused set of patent documents that can be used as the seeds of semantic queries to create a focused domain collection.
PatSnap’s semantic search capability was used to generate the domain collection for this analysis by executing 28 separate semantic queries using each of the documents named in the February 28th Interference decision. Each semantic query yields up to 1,000 of the most semantically similar patent documents. These queries were first executed as two subdomains and stored as separate workspaces within PatSnap. The first was for the 14 CVC documents and the second was the 14 Broad Institute documents. These subdomains were then combined into a single workspace so that the results of the 28 semantic queries were aggregated into a final domain collection for analysis. As the query results and subdomains are combined into a single workspace, duplicate patent documents are deleted automatically by the PatSnap tool. For the 14 patent documents assigned to the CVC group, this process resulted in a subdomain collection of 1,382 patent documents consisting of 373 simple patent families. For the 14 patent documents assigned to the Broad Institute group, this process resulted in a subdomain of 2,967 patent documents consisting of 757 simple families. Combing the two subdomains to produce the final domain collection resulted in a workspace with 3,455 patent documents consisting of 859 simple patent families. The patent document landscaping analysis was performed on this workspace.
The analysis begins by navigating to the specific workspace which is, as of this writing, accomplished via the left sidebar menu of PatSnap’s main analytics portal. Keep in mind that the PatSnap system is continually upgraded and improved and, thus, menus and capabilities may change from what’s described here. Nonetheless, when the specific workspace is selected, a spreadsheet-like view of the domain collection patent documents is displayed. The patent document landscaping information presented in this report is found via three analysis mechanisms from this workspace view. All three are found under the “Analysis” drop-down menu available near the top-middle of the workspace display. The first, titled “Custom Analysis”, enables the direct analysis of the workspace information. The second, titled “Insights”, enables the user to create an Insights Technology Report, which produces similar and often identical information as the Custom Analysis option. The principle different with the Insights Report is that the entire report can be exported as PowerPoint, PDF, Excel, or Word formatted files. But typically, for any analysis view available within Custom Analysis or the Insights Report, the user has options to export individual chart images (as PNG files) and the associated raw data (as Excel spreadsheets). The third analysis option is available via the “Landscape” option of the Analysis drop-down and enables the user to display and explore a topographical landscape diagram of the domain collection patent documents.
Finally, it’s important to note that the analysis results produced in the Custom Analysis, the Insights Report, and the Landscape diagram will each present results reflecting the patent document grouping selection as set via the “Group Display” option available on workspace page. This grouping selection determines whether the patent documents are analyzed as ungrouped, with all documents in the workspace analyzed separately, or as grouped by patent family, where only one patent document is analyzed per patent family. Analyzing as grouped or ungrouped often depends on the situation. If, for a particular domain collection, each unique patent is filed in multiple countries, it’s often better to analyze the information as grouped so that the analytics are not inflated by the duplicate patent filings around the world. This is clearly the case with these CRISPR patent filings as these are filed very broadly worldwide. However, there are situations (such as with landscape diagrams) where it’s advantageous to display the results as ungrouped simply to represent the worldwide emphasis of the patent documents in the domain collection. In the analysis presented below the grouped or ungrouped nature of the results is noted by each exhibit. However, most results are derived from the domain collection workspace as grouped, where there is one representative patent document per simple family. The landscape diagram is the exception where the patent documents are displayed in an ungrouped fashion.
Exhibit 1: The 28 Patent Documents from the February 28, 2022 PTAB Interference Proceeding

Step 2: Profile the Domain Collection
The initial profiling of the domain collection is designed to provide overview information about the patent documents and the IP sector. For example, exhibit 2 below, entitled Top 10 Current Assignee Countries, tabulates the countries of assignees across all grouped patent families in the domain collection. This table is designed to show the geographic concentrations of the owners of the intellectual property. Within PatSnap this information is available via the Custom Analysis, under the Authority drop-down, and the Top Current Assignee Regions option. For the CRISPR domain collection this is indicating that the assignees of the fundamental IP largely reside in the United States, which is not unexpected given that the initial patent filings in this IP sector were by the Berkeley group and the Broad Institute group. PatSnap provides other ways to display similar information such as the tabulation of countries where applications are being filed, which shows were IP protection is being pursued. This is less insightful for the CRISPR domain collection as these patent documents are being filed in nearly every patent jurisdiction worldwide.
Exhibit 3 shows the simple legal status of the patent documents in the domain collection and presents the data corresponding to the filing stages of the documents. The PCT (Patent Cooperation Treaty) classifications refer to the initial filing stages of internationally designated patent applications. The Pending classification refers to applications that are pending in national stage examinations and the Active classification refers to granted patents. This chart is often useful in providing insight into the maturity of an IP sector. Within PatSnap the legal status information is available via the Insights Report under the Innovation Profile section of the left sidebar. For the CRISPR domain collection, exhibit 3 is indicating that it’s still early in the evolution of this IP sector as 45% of the patent families are still in pending stage and only approximately 20% have been granted.
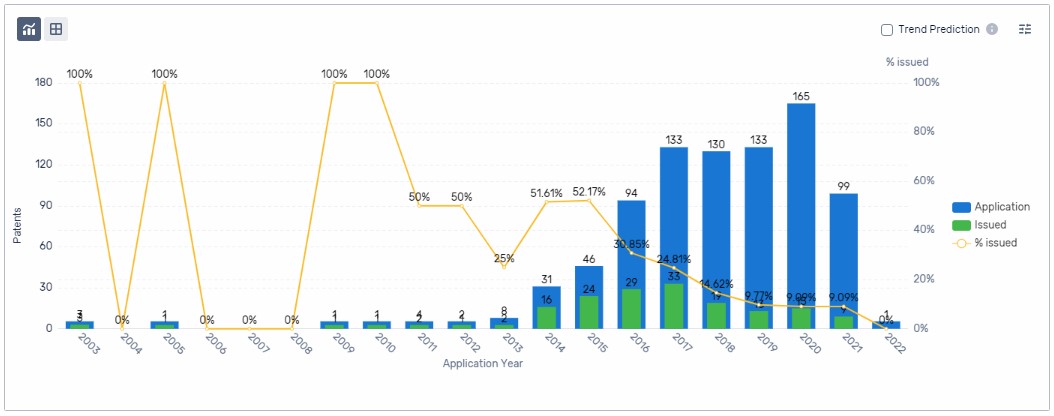
Exhibit 4 show the applications and granted patents timeline and provides a concise view of the historic trend of patenting activity embodied in the domain collection. The chart shows the number of granted patents resulting from applications filed in the same year. This is helpful for understanding the application filing rate as well as the grant rate for the IP sector. The application filing rate can be an indicator of the IP competitive landscape and the grant rate can be an indicator of the approval environment. Also note that the most recent data (the most recent ~18-24 months) is likely only partial data, as there are publishing delays and sometimes long pendency times (time between application and grant approval) associated with various patent jurisdictions. Within PatSnap this information is available in the Insights Report under the Innovation Profile heading. For the CRISPR domain collection the increasing application numbers and the decreasing grant rate both indicate an increasingly competitive environment with more applications being filed and fewer granted patents being allowed on a percentage basis. The current grant rate for this IP sector is approximately 10%.
Exhibit 2: Top 10 Current Assignee Countries (Showing grouped patent document information)

Exhibit 3: Simple Legal Status (Showing grouped patent document information)
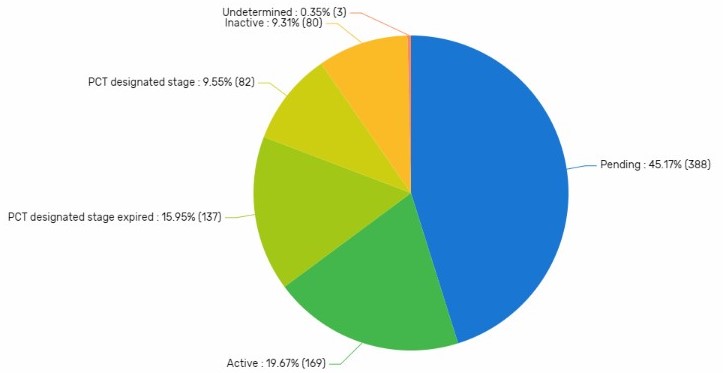
Exhibit 4: Applications and Granted Patents Timeline (Showing grouped information)
Step 3: Tabulate the Assignees and Inventors
The top inventors’ and top assignees’ tables help identify the people and entities associated with the domain collection and the IP sector. These tables can be instrumental in helping identify the IP experts, in assessing the competitive landscape, and in identifying potential collaborators, investors, M&A targets, or emerging start-ups. Within PatSnap the top inventors’ and the top assignees’ tables are available in both the Custom Analysis and Insights Report sections, and both show identical information. The charts and data can be accessed via specific options (via Inventor or Assignee designations) in the left sidebar of each section.
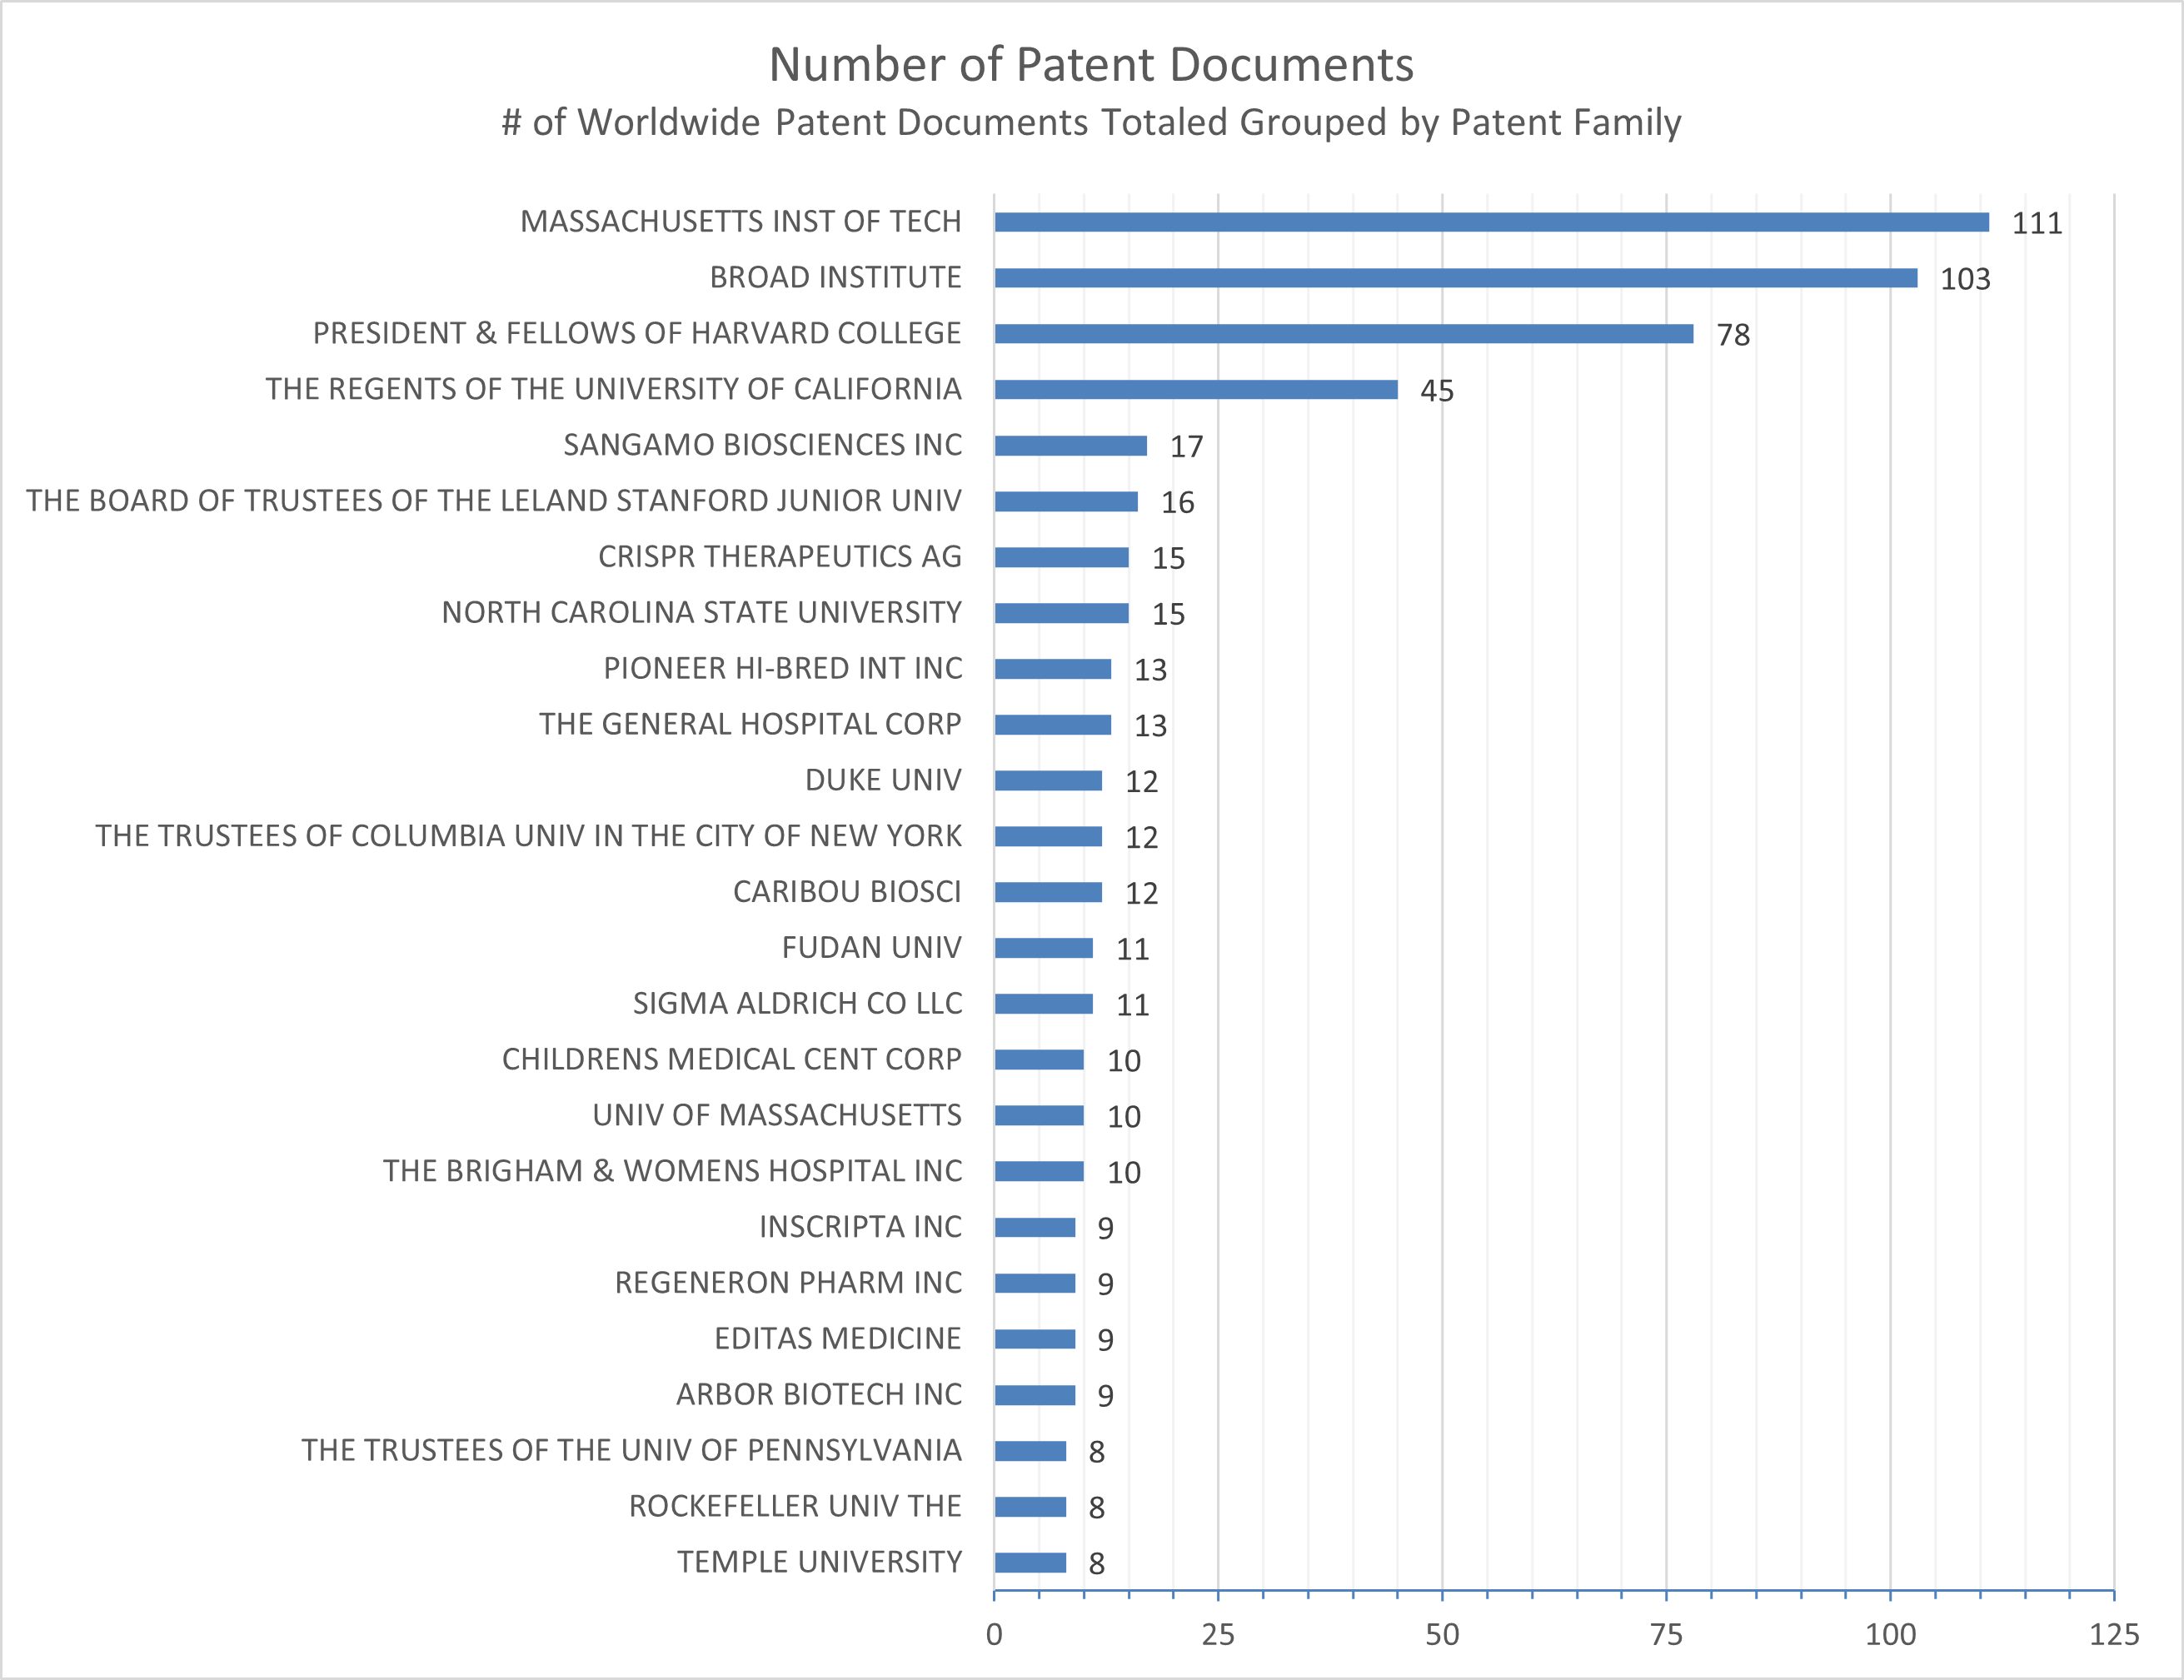
Exhibit 5 shows the top 10 inventors for the CRISPR domain collection and essentially lists the individuals who are the top intellectual property experts. As expected, this list is led by individuals associated with the Broad Institute group and the Berkeley group. Exhibit 6 shows the top 25 standardized current assignees. The standardization of assignees in this list is a process within PatSnap where assignees and tabulations of patent documents are aggregated to account for M&A transactions and situations where an assignee is a division of a parent corporation. That is not much of an issue with the CRISPR domain collection shown in exhibit 6 but can often be confusing in other IP sectors. PatSnap also offers the ability to show the non-standardized, or original assignee, tabulations of this list.
For the CRISPR domain collection the top assignees consist of the Broad Institute group (including Harvard and MIT) and the University of California Berkeley. But also included in the top 25 list are many of the newer companies formed around the CRISPR technology. CRISPR Therapeutics AG, the 7th ranked assignee, was founded in 2012, has operations in Switzerland and the United States, and was co-founded by Emmanuelle Charpentier. Caribou Biosciences, the 13th ranked assignee, was founded in 2011 in Berkeley California, and has connections to many of the principal scientists associated with the Berkeley group, including Jennifer Doudna (co-founder of Caribou), Rachel Haurwitz (co-founder and CEO of Caribou), Martin Jinek (co-founder and advisor to Caribou), and James Berger (co-founder and advisor to Caribou). Jennifer Doudna is a Professor of Chemistry, Biochemistry & Molecular Biology at UC Berkeley and the 2020 Nobel Prize winner in Chemistry, along with Emmanuelle Charpentier, for the development of the core CRISPR technology. Rachel Haurwitz, Martin Jinek, and James Berger, are all scientists that have been associated with the development of CRISPR at UC Berkeley. Inscripta Inc., the 19th ranked assignee, was founded in 2015 in Denver Colorado, and is developing platforms for scalable digital genome engineering. Finally, Editas Medicine, the 21st ranked assignee, was founded in 2013 in Cambridge Massachusetts, and has founders associated with the Broad Institute group, including Feng Zhang (Professor at MIT and a core institute member of the Broad Institute), George Church (Professor of Genetics at Harvard Medical School) and Keith Joung (Professor of Molecular Pathology at Harvard Medical School), as well as Jennifer Doudna from Berkeley.
Exhibit 5: Top 10 Inventors (Showing grouped patent document information)
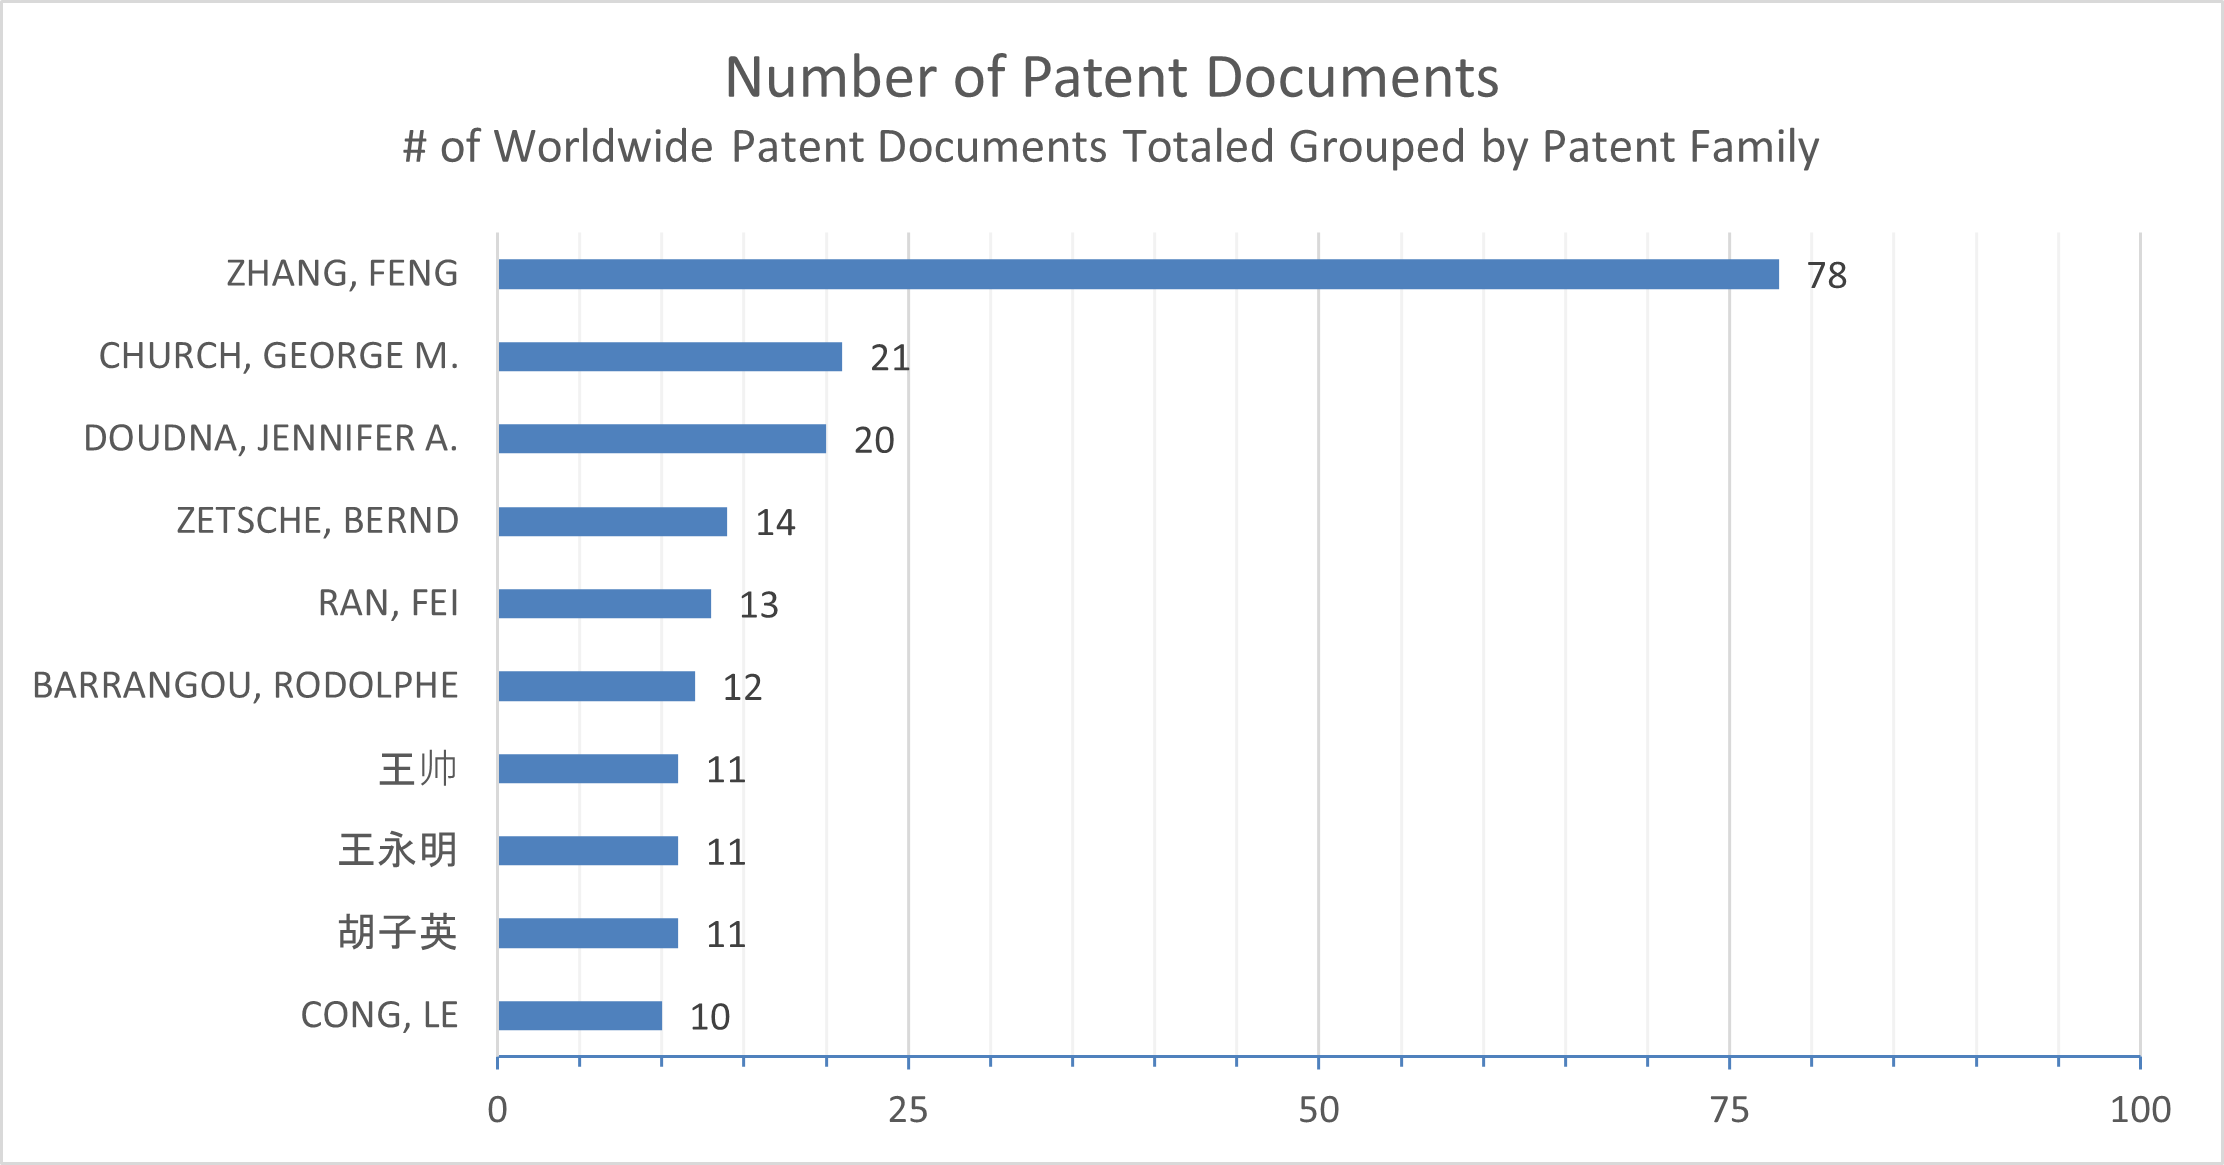
Exhibit 6: Top 25 Standardized Current Assignees (Showing grouped patent document information)
Step 4: Analyze Citations
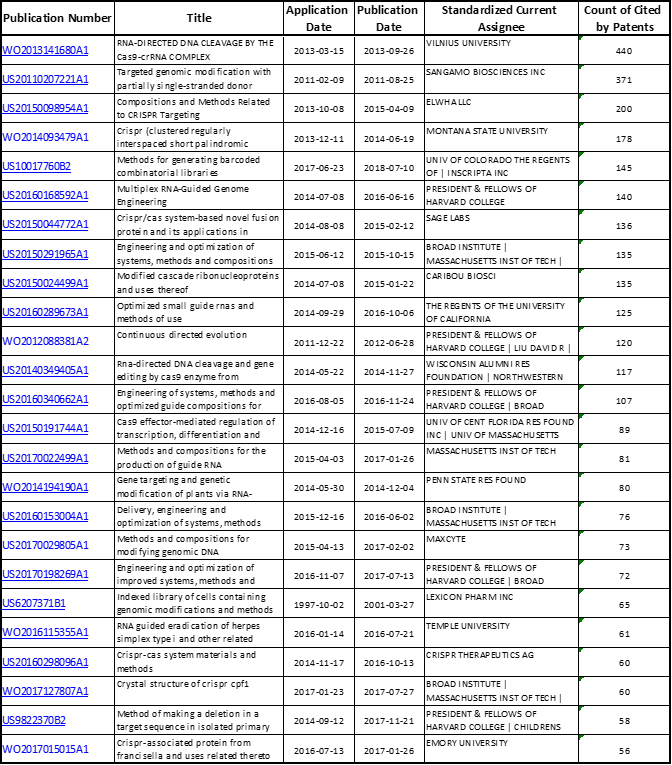
Exhibit 7 is the top citations table and shows the most cited patent documents across all the documents in the domain collection and can help identify foundational prior art and important patent references as well as additional IP competitors (assignees) in the sector. A cited patent document is typically a patent application or granted patent that is considered significant (prior art, or in some way relevant) to the patent application that cites it. Exhibit 7 thus represents the list of the top 25 most cited patent document references on granted patents and patent applications in the CRISPR domain collection. These cited patent documents may or may not be in the domain collection, but nonetheless represent notable references relevant to the IP sector.
Within PatSnap the most cited patent documents of the domain collection are shown in the Insights Report (left sidebar, “Key Patents” heading). The first table enables bar chart views of the top 10, top 20, or top 50 most cited patent documents. These views show only the cited patent document publication numbers and the total number of times the documents were referenced by all documents in the domain collection. Like similar information produced in the Insights Report, the total citation counts are tabulated from the workspace from which the Insights Report was created and thus reflect the grouped or ungrouped nature of the workspace. To analyze the citations list further, PatSnap provides the ability to export the citations list from the bar chart view to a separate workspace. Exhibit 7 was produced by exporting the top 50 citations to a workspace and then exporting that workspace to a local Excel spreadsheet to produce the list of the top 25 citations.
For the CRISPR domain collection, many of the most cited patent documents have assignees from the Broad Institute group (including Harvard and MIT), and UC Berkeley, as well as companies noted in the top assignees table of exhibit 6 (Sangamo Biosciences, Caribou Biosciences, and CRISPR Therapeutics). In addition, other post-secondary educational research institutions show as having important IP in this sector. Finally, one addition citation and assignee to note is the 3rd ranked citation, a patent application filed by and assigned to Elwha LLC. Elwha is a subsidiary of Intellectual Ventures which is a business involved in the acquisition, licensing, and assertion of patents. This is essentially a non-practicing entity (NPE) patent holding company. These types of companies are often viewed as litigation risks in IP sectors because the company’s revenue is derived solely from the licensing of its patent portfolio. The particular patent application in the citations table, that’s assigned to Elwha, looks to have been abandoned in approximately 2016, but its important to note the presence of Intellectual Ventures in this sector and the prior art significance of its abandoned application.
Exhibit 7: Top 25 Most Cited Patent Documents (As tabulated from the grouped set of domain collection patent documents)
Step 5: Analyze Patent Document Technology Classification Codes
Patent document technology classification codes are often utilized to gain insight into the technology applied in an IP sector or domain collection by analyzing the patent document information, the assigned class codes, and the description of those class codes. Classification codes are assigned to every patent document to categorize the inventive ideas. Patent documents can be assigned multiple classification codes representing each potentially different inventive idea embodied in the patent filing. This information can be analyzed and tabulated in different ways. PatSnap offers many analysis techniques within both the Custom Analysis and Insights Report sections to view this information. The challenge is that the classification code descriptions tend to be rather broad and generalized, resulting in somewhat superficial summary landscaping results. One often needs to dive further into the detailed patent document text to get a more complete technology understanding.
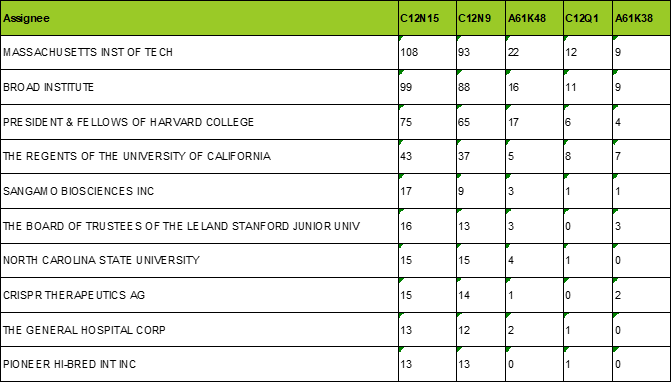
Nonetheless, at a higher level it can be useful to analyze the technology classification codes. For example, one analysis that tends to be valuable, is the break-down of the technology classification codes as applied to the patent documents of the top assignees. This generally shows the broader areas of focus for those top assignees. This is usually accomplished by tabulating the top classification codes, complete with code descriptions, and then tabulating the codes assigned to patent documents on an assignee basis. Within PatSnap the top IPC technology classification codes information can be found in the Insights Report under the “Key Technologies” heading. The data pertaining to the top IPC codes of the top assignees can also be found in the Insights Report but under the “Assignees Analysis” heading. Both sets of information can be displayed in tabular formats and exported as Excel spreadsheets.
Exhibits 8 and 9 show this information for the CRISPR domain collection. The top five classification codes of the patent documents in the domain collection as well as the corresponding descriptions of the class codes are shown in exhibit 8. Exhibit 9 then shows the tabulation of the top five class codes as applied to the patent documents of the top 10 assignees. For the CRISPR domain collection the vast majority of the inventive ideas fall into two classifications, namely C12N15 (described as “Mutation or genetic engineering; DNA or RNA concerning genetic engineering, vectors, e.g. plasmids, or their isolation, preparation or purification.”) and C12N9 (described as “Enzymes, e.g. ligases; Proenzymes; Compositions thereof.”).
Exhibit 8: Top 5 IPC Technology Classification Codes (As tabulated from the grouped set of domain collection patent documents)

Exhibit 9: Technology Focus of Top Assignees (As tabulated from the grouped set of domain collection patent documents)
Step 6: Use Landscape Diagraming to Explore the Domain Collection
Patent landscape diagramming is a versatile technique that can be used to visualize and explore a patent document domain collection. PatSnap provides this capability as an interactive environment via a Web interface under the Landscape option of the Analysis drop-down from the workspace view page. This capability can be very instrumental in developing IP strategy by enabling the visual exploration of a domain collection via analysis using keywords or phrases, assignees, groupings of assignees, and other patent document meta data.
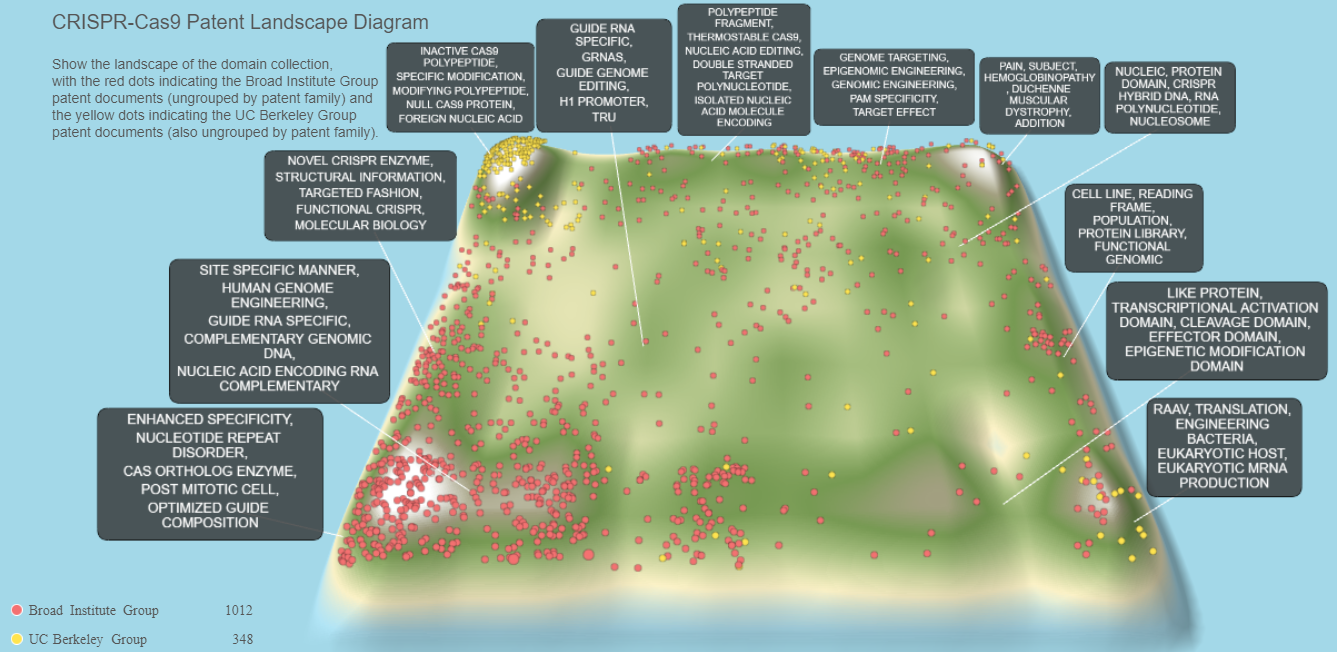
The main landscape diagram is generated via natural language processing (NPL) and semantically similar text clustering of the patent documents in the domain collection. A topographical diagram is generated using all the documents of the domain collection with topographical peaks representing higher concentrations of patent documents and troughs representing areas with lower concentrations or no patent documents at all. Textbox callouts are then generated for the higher concentrations and significantly differentiated text clusters.
The landscape diagraming environment provides a variety of techniques to explore the current landscape of patent documents and enables the user to derive insights and new patenting strategies for the IP sector, such as brainstorming new innovations, or crafting ideas that avoid high concentrations of patent documents or specific patent filings from competitors. For example, colored dots can be added to represent the specific patent documents from various assignees or groupings of assignees. Text queries can then be used to quickly explore the landscape, showing patent documents matching the query, and allowing the user to determine keywords or phrases that are either present, lightly represented, or nonexistent. In addition, free-form text, potentially representing the description of new innovative technology or maybe the pre-filing draft of a patent application, can be semantically placed on the diagram and provide a general indication regarding uniqueness and the level of comparable IP from the domain collection.
An example of an analysis for the CRISPR domain collection is show in exhibit 10. This shows the topographical landscape diagram created from the 3,455 ungrouped patent documents of the domain collection. Textbox callouts have been automatically added for the NLP-derived clusters of patent documents. Red and yellow dots have been added to the diagram that represent the patent documents assigned to the entities of the Berkeley group (yellow dots) and the Broad Institute group (red dots). This visualization shows how the semantic analysis algorithm has differentiated the focus areas of the two research organizations, with the Berkeley group patent documents mostly in the upper-left corner of the diagram and the Broad Institute group documents in the lower-left corner. Interestingly, this analysis, at cursory level, seems to align with the USPTO PTAB decision from the first Interference proceeding (dated February 15, 2017) between the Broad Institute group and the Berkeley group, which concluded that the two research groups had claimed patentably distinct subject matter in their respective patent filings.
Exhibit 10: CRISPR Patent Landscape Diagram (Showing ungrouped patent document information)
 |
Jim Moeller provides customized consulting services leveraging analytics and data science tools, for data integration and intelligence mining, aimed at projects focused on intellectual property research, market analysis, and business development. Executed project domains have covered medical devices, pharmaceuticals, biotechnology, digital and connected health, wearables, telemedicine, IoT (Internet-of-Things), and wireless communications. Jim is a U.S. Registered Patent Agent with experience spanning consulting, investment banking, and engineering. https://www.MoellerVentures.com. |