
An Estimate of the Value of Qualcomm’s Patents - September 1, 2011
(Average Read-Time: 6 minutes, Word Count: 1,255.)
Qualcomm has long been one of my favorite intellectual property companies, for two reasons. First because back in the late 1980’s and early 90’s I worked for a small start-up company named Uniplex Corporation, where we were developing spread spectrum CDMA-like wireless technology for the 902-928MHz unlicensed band. I remember tracking technical articles that Qualcomm published and was always impressed by their research and the technology the company patented. Many years later I covered the company as an analyst in the investment banking industry and was equally impressed by the licensing and royalty revenue stream that they developed as a mature company. With all the recent activity in regard to the purchase of Nortel’s patents and Google’s pending purchase of Motorola Mobility I thought it would be an interesting analysis to compute an estimated value of Qualcomm’s patent portfolio.
Computing the value of any patent portfolio, such as the Nortel or Motorola Mobility transactions, can be a very complex process that’s built on numerous estimates and more detailed analysis of the patents, the time-frame of applicability, the justifiable value based on cash flows, discount rates for factoring the time-value of the cash flows and future risks, as well as other more vague characteristics such as the utility in defending other related market positions. Qualcomm makes it a bit easier as the company reports it total revenue broken down into two categories, equipment and services, and licensing and royalties. My analysis will focus on the licensing and royalties revenue category. In general, my approach will utilize a present value calculation of the net after-tax cash flows derived from these revenues over a 10-year period of time. I chose a 10-year time period because I felt it was long enough to be considered “longer-term”, but likely not long enough to be beyond the revenue generating capability of the current patents. Beyond 10-years one could argue that licensing and royalty revenue is more likely to depend on future patented technology than on the current portfolio.
First, I’ll need to dissect the licensing and royalty revenue line, and make a reasonable projection as to the growth of that revenue over the next 10 years. I’ll start with the reported licensing and royalty revenue numbers from the quarterly and annual reports. Figure 1 below shows the spread sheet of this analysis with the top line being the reported licensing and royalty revenue. Figure 2 shows a chart of this revenue with an overlaid trend line (standard exponential growth trend line), shown in red, extrapolating a 15.8% growth rate and shown five quarters into the future. Clearly there’s an abnormality in the March quarter of 2011 that dramatically alters the extrapolated growth. In fact, in reading the details from that quarter, Qualcomm indicates that there was an extra $400 million in licensing and royalty revenue that resulted from litigation settlements that was actually due in previous quarters.
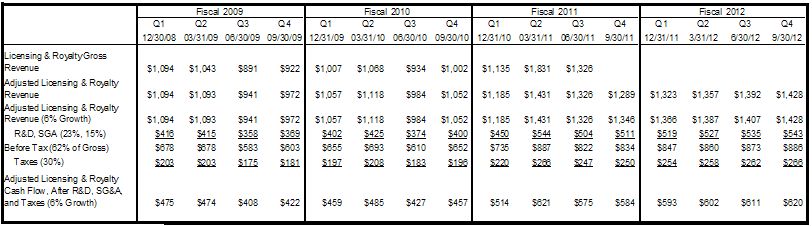
Figure 1: Qualcomm’s Licensing and Royalty Revenue Analysis
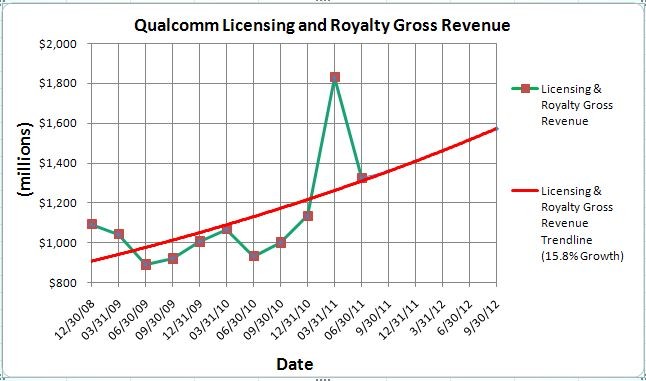
Figure 2: Qualcomm Licensing and Royalty Gross Revenue
To better extrapolate future growth, I’ll need to adjust for the revenue abnormality from the March 2011 quarter. Without any additional information as to how that $400 million is distributed over the previous quarters, I’ll simply evenly distribute the revenue and add $50 million to each of the previous eight quarters. I’ll call this the “Adjusted” Licensing and Royalty Revenue as shown as the second line of Figure 1 and also shown as the green line in the chart of Figure 3 below. The red line in Figure 3 indicates the trend line for the adjusted licensing and royalty revenue, and extrapolates a 10.8% growth rate, which is much more reasonable then the 15.8% projected in Figure 2. However, when projecting out over longer periods of time even a 10% growth rate likely exceeds basic overall economic growth metrics and probably doesn’t represent a maturing market. As a result, to project the longer-term revenue numbers I’ll trim another 4% off that growth rate and use a 6% growth rate to project the licensing and royalty revenue over the next 10 years. This is shown as the third line of the table in Figure 1 and as the fine blue line in Figure 3 (shown as projected only over the following five quarters).
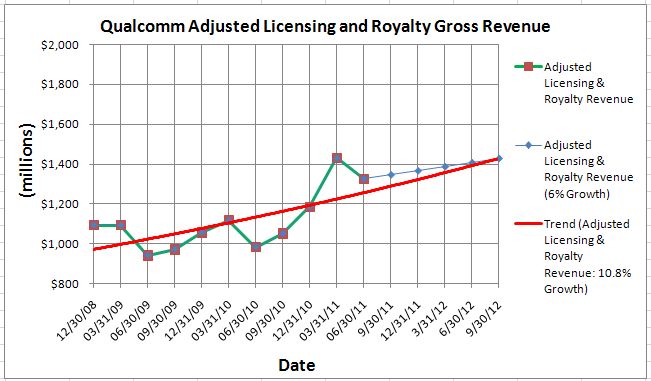
Figure 3: Qualcomm Adjusted Licensing and Royalty Gross Revenue
Next I’ll subtract the expenses and taxes associate with this revenue to derive the net cash flows. Since there are no physical products associated with the licensing and royalty revenue, there are no “cost-of-goods-sold”. However, there are research and development expenses (R&D) associated with the continued core development of the intellectual property as well as general expenses (Sales, General & Administrative, i.e. “SG&A”) associated with the upkeep of the patents, typically expenses related to the legal support of the patent portfolio. In lieu of more detailed expense information associated with just the licensing and royalty revenue, I’ll assume that the R&D and SG&A expenses are approximately the same percentage as Qualcomm’s overall R&D and SG&A expenses. For my analysis, I’ll set R&D at 23% and SG&A at 15% of the adjusted licensing and royalty gross revenue. In addition, taxes need to be subtracted. Qualcomm’s reported overall corporate tax rate can typically be lower than the statutory corporate rate due to various reasons, but for my analysis I’ll use a 30% tax rate to better represent a market value for the patent portfolio. These expenses are shown in lines 4 and 6 in the table of Figure 1. When the expenses and taxes are subtracted from the adjusted licensing and royalty gross revenue the result is the bottom line in the table of Figure 1 showing the net after tax cash flows from the licensing and royalty revenue. These cash flows are also shown in the chart of Figure 4.
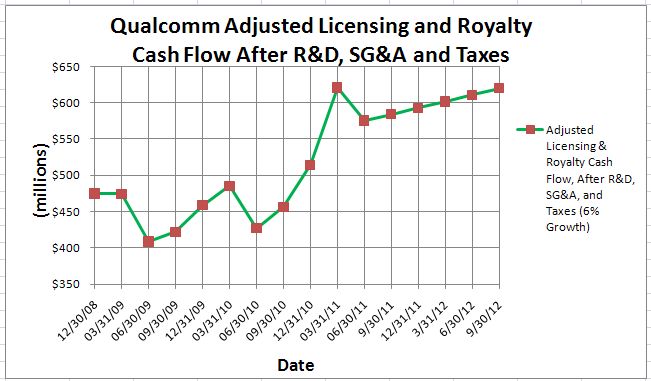
Figure 4: Qualcomm Net, After Tax Cash Flows from Adjusted Licensing and Royalty Gross Revenue
Now that I’ve derived the net cash flows and projected those 10 years into the future, I can apply a present value calculation to determine a current market value. The present value calculation, of course, needs a discount rate to factor in issues such as the time-value of money, the cost of capital, and any additional market risks that could threaten the future cash flows. For most corporate valuation situations, this discount rate starts at the weighted average cost of capital (WACC) for the business. For Qualcomm in particular, I’ve seen various WACC estimates in the 9% to 12% range on an annualized basis. The market associated risk is more difficult to estimate, but one can argue that the high-tech nature of the mobile communications technology market should result in a rather significant addition to the WACC discount rate. A more detailed fundamental analysis could factor in specific market shifts and competing technology and potentially derive a more reasoned estimate, but for the moment I’ll simply use an annual WACC of 10% and add an additional 10% to represent the market risk. Using a 20% discount rate, the net present value of the 10-year cash flow (i.e. the net, after tax adjusted licensing and royalty revenue cash flow show in Figure 4) from Qualcomm’s licensing and royalty revenue is approximately $12.4 billion. According to information published by Qualcomm, the company currently has more than 9400 patents and patent applications. Rounding that number to 9450 I calculate a per-patent value of approximately $1.3 million, or not quite twice as much as the approximately $750,000 spent per patent in the Nortel and Motorola Mobility transactions.